
FIGURE
Fig. 3
Fig. 3
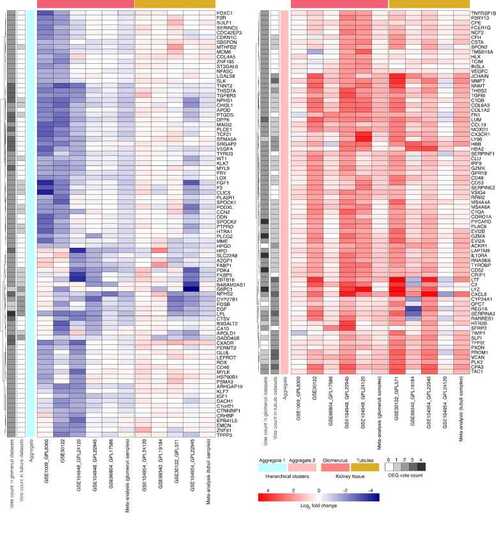
Heatmap of core DEGs human DN kidney tissue samples compared with healthy controls. To simplify visualization, the groups branching from the first hierarchical cluster dendrogram were split and situated side-by-side, labeled “Aggregate 1″ and “Aggregate 2″. The vote counts represent the number of times a gene was significantly down- or up-regulated (Log2 FC = 1.5, FDR<0.05). |
Expression Data
Expression Detail
Antibody Labeling
Phenotype Data
Phenotype Detail
Acknowledgments
This image is the copyrighted work of the attributed author or publisher, and
ZFIN has permission only to display this image to its users.
Additional permissions should be obtained from the applicable author or publisher of the image.
Full text @ Comput Struct Biotechnol J