
FIGURE
Fig. 2
Fig. 2
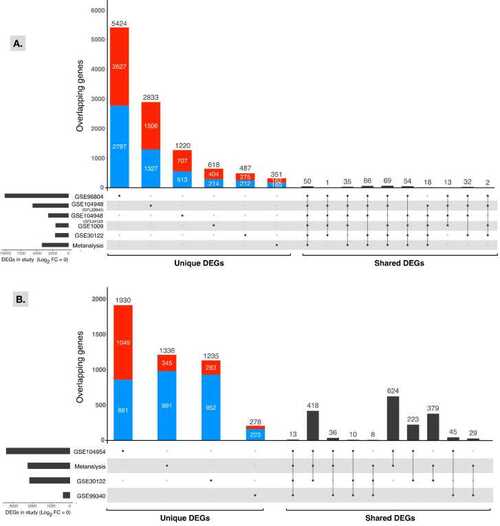
UpSetR plot of unique and shared DEGs among individual datasets. The number of total DEGs in each target glomerulus (A) and tubules (B) dataset is shown on the left side of the figure, and the left side of the figure shows the number of DEGs unique to each study, followed by the top 10 shared gene sets. Directionality of gene expression for unique genes is represented by red for upregulated genes and blue for downregulated genes. |
Expression Data
Expression Detail
Antibody Labeling
Phenotype Data
Phenotype Detail
Acknowledgments
This image is the copyrighted work of the attributed author or publisher, and
ZFIN has permission only to display this image to its users.
Additional permissions should be obtained from the applicable author or publisher of the image.
Full text @ Comput Struct Biotechnol J