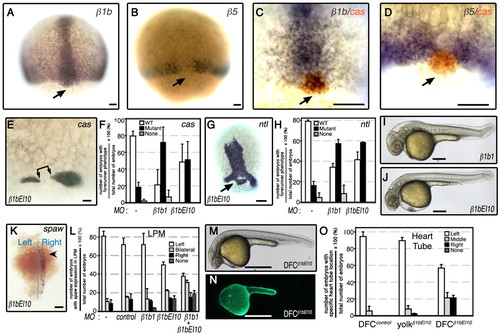
Integrin β1b morphants phenocopy the organ asymmetry defects of αV morphants. (A,B) Dorsal views of wild-type embryos at 80% E, hybridized with a probe to β1b and β5. Putative DFCs are positive for β1b transcripts (black arrow; A), and β5 transcripts are present in the marginal cells where there is a gap in this expression field (black arrow, B). (C,D) Double WISH samples showing simultaneous expression of cas (red orange) and β1b (dark purple; C); or cas (red orange) and β5 (dark purple; D). (E-H) Dorsal views of embryos, slightly tilted to visualize cas (E) and ntl (G) expression in DFCs. Delivery of β1b MOs to 1- to 4-cell-stage embryos caused improper formation of forerunner cell cluster, assessed by cas (E) and ntl (G) expression in DFCs at 80% E. DFCs in β1b morphants had occasional gaps and were separated from the axis (black arrow in G). (F,H) Bar graphs summarize DFC phenotypes using cas or ntl as markers. Phenotypic classification of DFCs and data analyses were similar to those in Fig. 3. (I,J) β1b morphants developed undulated tail and abnormal head phenotype, which were evident at 32 hpf. (K) spaw expression in β1b morphants in lateral plate mesoderm (LPM) in 15-17 somite stage (SS) embryos. Dorsal view of a representative β1bEI10 morphant (5 ng) showing right-sided spaw in LPM (arrowhead). (L) Bar graph showing the effects of β1b integrin loss-of-function on localization of spaw expression. (M) When β1bEI10 was injected into yolk at mid-blastula stage (512-1000 cells), animals had wild-type phenotype. (N) A representative fluorescence image corresponding to M that shows MO presence only in the yolk cell. (O) Bar graph showing effects of β1b integrin loss selectively in DFCs on heart tube location. Data expressed are similar to those in Fig. 1E. Scale bars: 50 μm in A-D; 20 μm in E; 100 μm in G,K; 500 μm in I,J,M,N.
|
