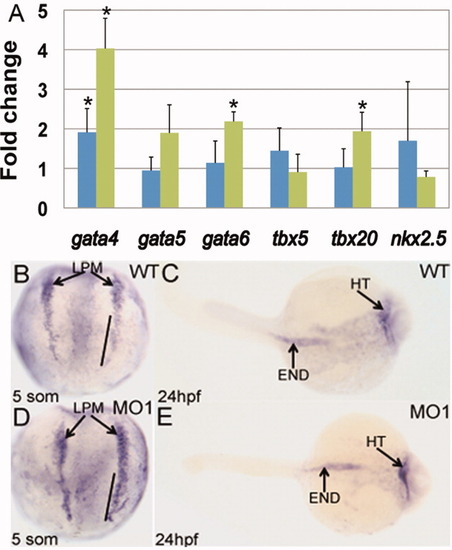
Gata4 transcript levels are increased for mga morphants in lateral plate mesoderm and the heart tube. A: Results of quantitative RT-PCR assays comparing gene expression levels for Mga morphants at 5 somites (blue) and 24 hpf (green) for the indicated cardiogenic genes. Shown is the average fold change in expression calculated from at least 3 independent experiments, with samples analyzed each time in triplicate. Samples were normalized to transcript levels for β-actin, and morphant transcript levels were quantified considering wildtype levels as 1. Student′s t-test was performed comparing standard differences of the mean. The asterisks indicate statistically significant differences (P ≤ 0.05) compared to control (at both stages in the case of gata4). B, D: In-situ hybridization using a gata4 probe shows increased gata4 transcript levels in the lateral plate mesoderm (LPM) comparing WT (B) and MO1 morphant embryos (D) at 5 somites. Note in particular the increase in the gata4 levels in the caudal region of the lateral plate mesoderm (denoted with a solid line). C, E: The gata4 transcript levels at 24 hpf appear increased in the heart (HT) of morphants (E), but not changed in the gut/endoderm (END). Views (B, D) are dorsal, anterior to the top. Views (C, E) are dorsal, anterior to the right.
|
