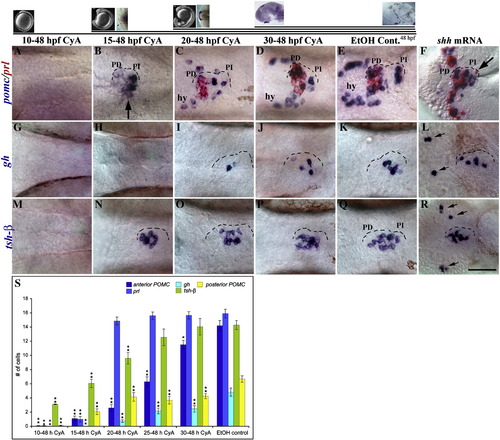
Temporal requirement for Hh signaling in endocrine cell differentiation. (A) Cyclopamine (CyA) treatments from 10 to 48 hpf largely eliminated prl and pomc expressing cells. (B) CyA treatments from 15 to 48 hpf severely reduced the number of prl (red) and anterior pomc expressing cells, while posterior pomc cells were mildly reduced (arrow). (C, D) CyA treatments from 20 to 48 hpf or 30 to 48 hpf had little effect on prl (red) and pomc (blue) cell numbers in the placode, however hypothalamic (hy) pomc cells were reduced in number. (E) Control embryo treated with an equal volume of EtOH (CyA carrier) has normal numbers of prl and pomc expressing cells. (F) shh mRNA injections induced prl and pomc expressing cells ectopically in the anterior brain and in the eye fields. Ectopic prl expressing cells were also seen in the PI (arrow). (G, H) CyA treatments from 10 to 48 hpf or 15 to 48 hpf eliminated gh expressing cells. (I, J) CyA treatments from either 20 to 48 or 30 to 48 hpf moderately reduced gh cell numbers. (K) gh expression in control embryo. (L) Ectopic gh expressing cells (arrows) were seen in 21% of shh mRNA injected embryos (n = 42), although the overall number of cells was largely unaffected. (M) CyA treatments from 10 to 48 hpf eliminated tsh-β expressing cells. (N–P) tsh-β cell numbers were mildly reduced by CyA treatments from 15 to 48 and 20 to 48, but unaffected by treatments from 30 to 48 hpf. (Q) Normal tsh-β cell numbers in a control embryo. (R) shh mRNA injections led to ectopic populations of tsh-β cells in the eye field (arrows). (S) Graph showing the number of cells expressing endocrine genes in these experiments, ± standard error. Significance was calculated for changes in cell number relative to controls. *p < 0.05; **p < 0.01. A minimum of 20 embryos were scored for each treatment. (A–R) Ventral views of 48 hpf embryos, anterior to the left. Scale bar: A–Q; 25 μm, R; 35 μm. Top is a time-line of CyA treatments with images of entire embryo and/or lim3 expression in the adenohyphysis at each corresponding age.
|
