
- Title
-
Evolutionarily conserved role of telomerase reverse transcriptase in programming the microenvironment via regulation of the cGAS-STING pathway
- Authors
- Akincilar, S.C., Fidan, K., Kumar, N., Ng, Q.F., Majee, P., Wu, L., Han, D.J.Y., Chan, C.H.T., Chua, J.Y.H., Idzham, K., Oji, A., Lee, W.J.J., Oehlers, S.H., Ikawa, M., Tergaonkar, V.
- Source
- Full text @ Nat. Cell Biol.
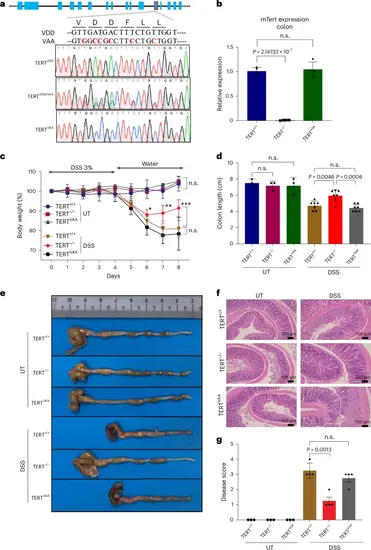
Generation of catalytically inactive TERTVAA mice. a, A schematic view of the mouse TERT gene (mTert) and editing strategy is shown to create enzymatically inactive TERT (TERTVAA). Genotyping results are shown for the wild-type (VDD), heterozygous (VAA/VDD) and homozygous (VAA) by Sanger sequencing. b, The graph shows mTert gene expression in colon tissues of TERT+/+, TERTVAA and TERT−/− mice by RT-qPCR (n = 4). Actin was used as a control. c, The treatment regimen of DSS is shown. The graph shows the percentage change in body weight of the TERT+/+, TERTVAA and TERT−/− mice (n = 3 for UT TERT+/+, n = 2 for UT TERT−/− and UT TERTVAA, n = 6 for DSS TERT+/+, n = 7 for DSS TERT−/− and DSS TERTVAA). d,e, The colon length of the mice treated with or without DSS at day 8 (n = 3 for UT samples, n = 7 for DSS samples) (d) and representative colon pictures (e) are shown. f, H&E staining of the colon sections from untreated or DSS-treated samples of TERT+/+, TERTVAA and TERT−/− mice. g, The bar graph displays the disease score (n = 3 for UT samples, n = 4 for DSS samples). Error bars indicate the mean ± s.d. P values were calculated by unpaired two-sided Student’s t-test (n.s., not significant). P values for b: DSS TERT+/+-versus-DSS TERT−/−, P = 2.14732 × 10⁻⁷; c: DSS TERT+/+-versus-DSS TERT−/−, day 6 P = 0.0378, day 7 P = 0.0021, day 8 P = 0.0009; d: DSS TERT+/+-versus-DSS TERT−/−, P = 0.0046; DSS TERT−/−-versus-DSS TERTVAA, P = 0.0006; g: DSS TERT+/+-versus-DSS TERT−/−, P = 0.0013. Source numerical data are available in Source data |
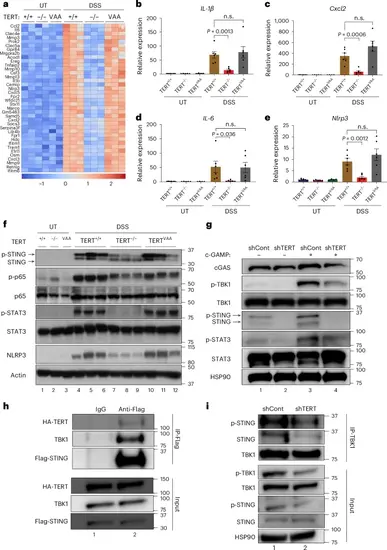
TERT regulates the expression of inflammatory genes. a, The heat map shows the gene expression differences in the colon tissues of TERT+/+, TERTVAA and TERT−/− mice treated with or without DSS at day 8 by RNA-seq (n = 2 for untreated, n = 3 for DSS-treated samples). b–e, The expression of IL-1β (b), Cxcl2 (c), IL-6 (d) and Nlrp3 (e) genes were analysed by RT-qPCR from the colon tissues of TERT+/+, TERTVAA and TERT−/− mice treated with or without DSS at day 8 (n = 7 for UT TERT+/+, n = 5 for UT TERT−/−, n = 4 for UT TERTVAA, n = 6 for each DSS group). Data were normalized to actin. f, The western blot shows the expression of STING (phosphorylated form in the top band, total in the bottom band), phospho-p65, p65, p-STAT3, STAT3 and NLRP3 (n = 3). Actin was used as a loading control. g, THP1 cells stably expressing shCont and shTERT plasmids were treated with c-GAMP for 4 h and analysed for the indicated proteins by western blot. HSP90 was used as a loading control. h, Cells were transfected with HA-TERT and Flag-STING plasmids. Forty-eight hours after transfection, cells were treated with c-GAMP for 4 h, and lysates were incubated with IgG or anti-FLAG antibodies. STING was immunoprecipitated using Protein G sepharose beads. Immunoprecipitants (IP) were probed for HA-TERT, TBK1 and Flag-STING proteins by western blot. i, TBK1 was immunoprecipitated from the c-GAMP-treated shCont and shTERT cells and analysed for the indicated proteins by western blot. HSP90 was used as a loading control. In g and i, representative blots are from two independent experiments. Error bars indicate the mean ± s.e.m. P values were calculated by unpaired two-sided Student’s t-test (n.s., not significant). P values for b: DSS TERT+/+-versus-DSS TERT−/−, P = 0.0013; c: DSS TERT+/+-versus-DSS TERT−/−, P = 0.0006; d: DSS TERT+/+-versus-DSS TERT−/−, P = 0.0036; e: DSS TERT+/+-versus-DSS TERT−/−, P = 0.0012. Source numerical data and unprocessed blots are available in Source data. |
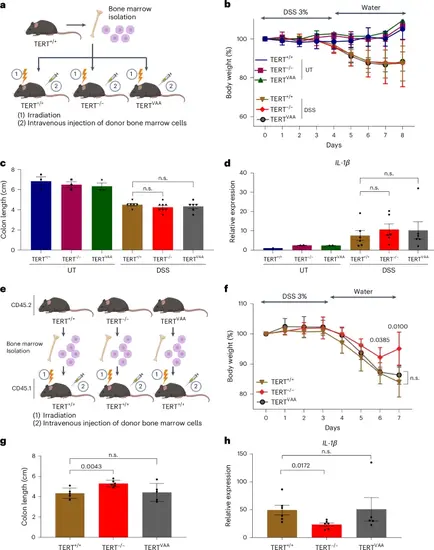
Immune cells are the primary cell type of the observed immunoregulatory roles of TERT. a, TERT+/+ bone marrow reconstituted TERT+/+, TERTVAA and TERT−/− mice treated with or without DSS for 8 days. b, The graph shows body weight measurements for each group. Error bars indicate the mean ± s.d. of two independent experiments (n = 3 for UT TERT+/+, n = 2 for UT TERT−/−, n = 2 for UT TERTVAA, n = 8 for DSS-treated groups). c, Colon lengths were measured on day 8. Error bars indicate the mean ± s.e.m. of two independent experiments (n = 6 for DSS TERT+/+, n = 8 for DSS TERT−/−, n = 6 for DSS TERTVAA). d, The graph shows the gene expression of IL-1β in colon tissues of TERT+/+ bone marrow reconstituted TERT+/+, TERTVAA and TERT−/− mice treated with or without DSS at day 8. Error bars indicate the mean ± s.e.m. of two independent experiments (n = 2 for UT TERT+/+, n = 2 for UT TERT−/−, n = 2 for UT TERTVAA, n = 6 for DSS-treated groups). e, Bone marrow transplantation from CD45.2 TERT+/+, TERT−/− and TERTVAA into CD45.1 TERT+/+ mice. f, The body weight change of recipient mice during the DSS experiment shown for each day. Error bars indicate the mean ± s.d. of two independent experiments (n = 5) (n.s., not significant). g, The colon length of DSS-treated CD45.2+ recipient mice measured. Error bars indicate the mean ± s.e.m. of two independent experiments (n = 5 for DSS TERT+/+, n = 6 for TERT−/−, n = 5 for DSS TERTVAA). h, The RNA level of IL-1β is shown as bar plots for TERT+/+ mice transplanted with TERT+/+, TERT−/− and TERTVAA bone marrow. Error bars indicate the mean ± s.e.m. of two independent experiments (n = 6 for with TERT+/+ and TERT−/−, n = 5 for TERTVAA). Actin was used as a normalizing control. P values were calculated by unpaired two-sided Student’s t-test (n.s., not significant). P values for f: DSS TERT+/+-versus-DSS TERT−/−, day 6 P = 0.0385; day 7, P = 0.01; g: DSS TERT+/+-versus-DSS TERT−/−, P = 0.0043. Panels a and e created with BioRender.com. Source numerical data are available in Source data. |
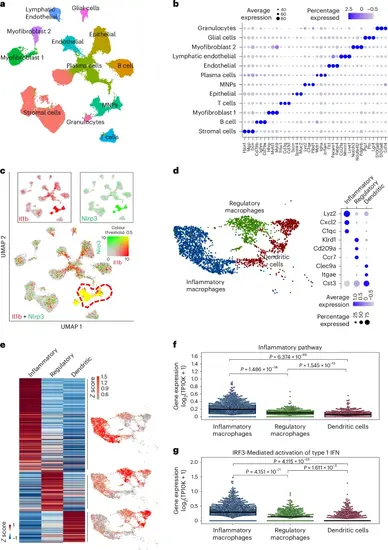
TERT regulates the expression of inflammatory response genes in myeloid cells. a, A UMAP plot of cells from mice colon tissues based on single-cell RNA seq. b, The bubble plot shows the cell-type-specific markers for each cluster in a. c, The expression of IL-1β and Nlrp3 genes is shown in cell clusters identified in a. Red and green colours indicate IL-1β and Nlrp3 gene expression, respectively. Yellow colour shows the co-expression in MNPs. d, UMAP of MNP subclusters (left) and expression of cluster specific markers (right). e, The heat map shows the DEGs between inflammatory macrophages, regulatory macrophages and dendritic cells (left). UMAP shows the average expression level of the DEGs for each cluster (right). f,g, Swarm plots show the average expression of the inflammatory pathway (f) and IRF3-mediated activation of type 1 IFN signature genes (g) for indicated cell types. Inflammatory macrophages n = 1,593, regulatory macrophages n = 626, dendritic cells n = 737. The line indicates the median expression. P values were calculated by two-sided Mann–Whitney test (n.s., not significant). P values for f: inflammatory-versus-regulatory macrophages, P = 1.486 × 10−56; regulatory macrophages-versus-dendritic cells, P = 1.545 × 10⁻¹⁵; inflammatory macrophages-versus-dendritic cells, P = 6.374 × 10−89; g: inflammatory-versus-regulatory macrophages, P = 4.151 × 10⁻²¹; inflammatory macrophages-versus-dendritic cells, P = 4.115 × 10⁻³³; regulatory macrophages-versus-dendritic cells, P = 1.611 × 10⁻³. Source numerical data are available in Source data. |
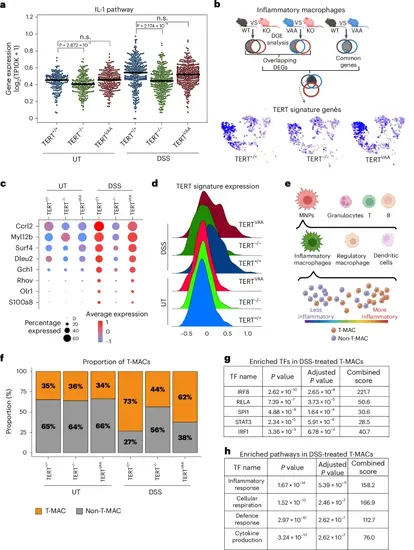
Single-cell analysis revealed a TERT-driven myeloid subpopulation. a, The swarm plot shows the average expression of IL-1 pathway genes in inflammatory macrophage clusters of DSS-treated or untreated TERT+/+, TERTVAA and TERT−/− groups. (UT TERT+/+ n = 164, UT TERT−/− n = 217, UT TERTVAA n = 252, DSS TERT+/+ n = 314, DSS TERT−/− n = 341, DSS TERTVAA n = 305 cells). The line indicates the median expression. P values were calculated by two-sided Mann–Whitney test (n.s., not significant). b, Simplified schematic approach of TERT signature gene set identification. Multiple pair comparisons between untreated and DSS-treated TERT+/+ (WT), TERTVAA (VAA) and TERT−/− (KO) inflammatory macrophages revealed genes that are significantly upregulated in DSS-treated TERT+/+ and TERTVAA but not in TERT−/−. UMAPs show the average expression of TERT signature genes in MNPs of TERT+/+, TERTVAA and TERT−/− groups. c, The feature plot shows the TERT signature genes across genotypes with and without DSS treatment. d, The average expression of TERT signature genes in TERT+/+, TERTVAA and TERT−/− groups with or without DSS treatment. e, A schematic representation of T-MAC identification. Cells highly expressing TERT signature genes among inflammatory macrophages are annotated as T-MACs and lowly expressing ones as non-T-MAC. f, The bar plot shows the proportion of T-MAC and non-T-MAC cells in inflammatory macrophages of TERT+/+, TERTVAA and TERT−/− groups with or without DSS treatment. g, The list of transcription factors (TF) enriched in controlling DEGs that are downregulated in TERT−/− T-MAC cells than the TERT+/+ T-MACs upon DSS treatment. P values were calculated by two-sided Fisher exact test. h, The list of enriched pathways based on the upregulated genes in DSS-treated TERT+/+ T-MACs compared with untreated TERT+/+ T-MACs. P values were calculated by two-sided Fisher exact test. P values for a: UT-TERT+/+-versus-UT-TERT−/−, P = 2.872 × 10⁻⁴; DSS-TERT+/+-versus-DSS-TERT−/−, P = 2.174 × 10⁻¹⁴. Panels b and e created with BioRender.com. Source numerical data are available in Source data. |
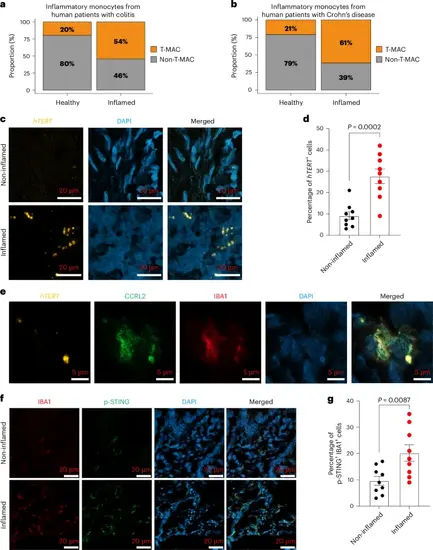
T-MACs drive human colitis. a, Bar plots show the proportion of T-MAC and non-T-MAC cells in inflammatory monocytes of healthy controls and and patients with colitis (a) and in monocytes of healthy controls and patients with Crohn’s disease (b). c, RNAscope-based in situ hybridization assay showing hTERT expression in non-inflamed and inflamed colon tissues from patients with ulcerative colitis. d, Quantification of hTERT+ cells in non-inflamed and inflamed colon tissues from three patients with ulcerative colitis. n = 3 (three fields for each sample). Error bars indicate the mean ± s.e.m. P values were calculated using unpaired, two-sided Student’s t-test method. e, In situ hybridization (RNAscope) assay for hTERT followed by sequential immunofluorescence of T-MAC marker (CCRL2) and macrophage marker (IBA1) in inflamed colon tissue from patients with ulcerative colitis. DAPI was used as a nuclear counterstain. f, Immunofluorescence staining of IBA1 and p-STING in non-inflamed and inflamed colon tissues from patients with ulcerative colitis. g, Quantification of IBA1+p-STING+ cells in non-inflamed and inflamed colon tissues from three patients with ulcerative colitis. n = 3 (three fields for each sample). Error bars indicate the mean ± s.e.m. P values were calculated using unpaired, two-sided Student’s t-test method. P values for d: non-inflamed-versus-inflamed, P = 0.0002; g: non-inflamed-versus-inflamed, P = 0.0087. Source numerical data are available in Source data. |
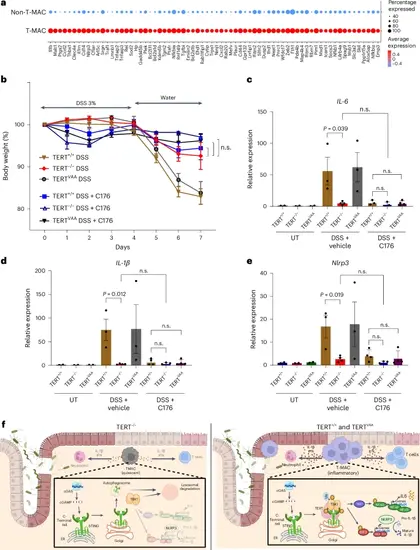
Therapeutic targeting of TERT-mediated activation of T-MACs reverses colitis. a, DEGs are shown between mouse T-MAC and non-T-MAC cells. b, The graph shows percentage changes in body weight of the DSS-treated TERT+/+, TERTVAA and TERT−/− mice with or without STING inhibitor (n = 5). Error bars indicate the mean ± s.d. P values were calculated by unpaired, two-sided Student’s t-test. c–e, The expression of IL-6 (c), IL-1β (d) and Nlrp3 (e) genes was analysed by RT-qPCR. Error bars indicate the mean ± s.e.m. P values were calculated by the unpaired, two-sided Student’s t-test method (n.s., not significant) (n = 2 for UT samples, n = 3 for DSS TERT+/+, TERTVAA and DSS + C176 TERT+/+, TERT−/−, n = 4 for DSS TERT+/+ and DSS + C176 TERTVAA. f, The model shows the activation of inflammatory T-MACs via the cGAS–STING pathway. Left: in the absence of TERT, T-MACs exhibit a diminished inflammatory response due to impaired STING–TBK1 interaction and alleviated kinase activity of TBK1. Right: in TERT+/+ and TERTVAA mice, TERT forms a ternary complex with STING and TBK1, enhancing TBK1 autophosphorylation. Subsequently activated TBK1 phosphorylates STING. This leads to expansion and activation of T-MACs and induces expression of type 1 IFN and NFκB genes. P values for c: DSS+vehicle TERT+/+-versus-DSS+vehicle TERT−/−, P = 0.039; d: DSS+vehicle TERT+/+-versus-DSS+vehicle TERT−/−, P = 0.012; e: DSS+vehicle TERT+/+-versus-DSS+vehicle TERT−/−, P = 0.019. Panel f created with BioRender.com. Source numerical data are available in Source data. |