
Fig. 1
- ID
- ZDB-FIG-250828-1
- Publication
- Akincilar et al., 2025 - Evolutionarily conserved role of telomerase reverse transcriptase in programming the microenvironment via regulation of the cGAS-STING pathway
- Other Figures
- All Figure Page
- Back to All Figure Page
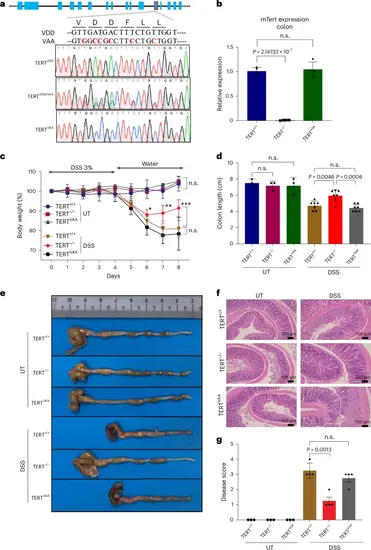
Generation of catalytically inactive TERTVAA mice. a, A schematic view of the mouse TERT gene (mTert) and editing strategy is shown to create enzymatically inactive TERT (TERTVAA). Genotyping results are shown for the wild-type (VDD), heterozygous (VAA/VDD) and homozygous (VAA) by Sanger sequencing. b, The graph shows mTert gene expression in colon tissues of TERT+/+, TERTVAA and TERT−/− mice by RT-qPCR (n = 4). Actin was used as a control. c, The treatment regimen of DSS is shown. The graph shows the percentage change in body weight of the TERT+/+, TERTVAA and TERT−/− mice (n = 3 for UT TERT+/+, n = 2 for UT TERT−/− and UT TERTVAA, n = 6 for DSS TERT+/+, n = 7 for DSS TERT−/− and DSS TERTVAA). d,e, The colon length of the mice treated with or without DSS at day 8 (n = 3 for UT samples, n = 7 for DSS samples) (d) and representative colon pictures (e) are shown. f, H&E staining of the colon sections from untreated or DSS-treated samples of TERT+/+, TERTVAA and TERT−/− mice. g, The bar graph displays the disease score (n = 3 for UT samples, n = 4 for DSS samples). Error bars indicate the mean ± s.d. P values were calculated by unpaired two-sided Student’s t-test (n.s., not significant). P values for b: DSS TERT+/+-versus-DSS TERT−/−, P = 2.14732 × 10⁻⁷; c: DSS TERT+/+-versus-DSS TERT−/−, day 6 P = 0.0378, day 7 P = 0.0021, day 8 P = 0.0009; d: DSS TERT+/+-versus-DSS TERT−/−, P = 0.0046; DSS TERT−/−-versus-DSS TERTVAA, P = 0.0006; g: DSS TERT+/+-versus-DSS TERT−/−, P = 0.0013. Source numerical data are available in Source data |