
|
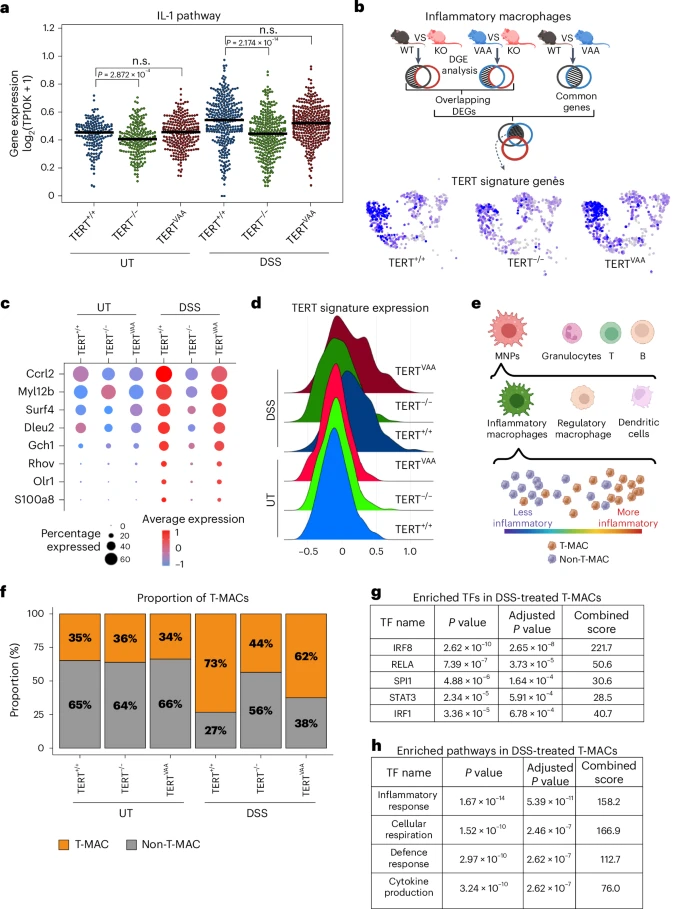
Fig. 5 Single-cell analysis revealed a TERT-driven myeloid subpopulation. a, The swarm plot shows the average expression of IL-1 pathway genes in inflammatory macrophage clusters of DSS-treated or untreated TERT+/+, TERTVAA and TERT−/− groups. (UT TERT+/+ n = 164, UT TERT−/− n = 217, UT TERTVAA n = 252, DSS TERT+/+ n = 314, DSS TERT−/− n = 341, DSS TERTVAA n = 305 cells). The line indicates the median expression. P values were calculated by two-sided Mann–Whitney test (n.s., not significant). b, Simplified schematic approach of TERT signature gene set identification. Multiple pair comparisons between untreated and DSS-treated TERT+/+ (WT), TERTVAA (VAA) and TERT−/− (KO) inflammatory macrophages revealed genes that are significantly upregulated in DSS-treated TERT+/+ and TERTVAA but not in TERT−/−. UMAPs show the average expression of TERT signature genes in MNPs of TERT+/+, TERTVAA and TERT−/− groups. c, The feature plot shows the TERT signature genes across genotypes with and without DSS treatment. d, The average expression of TERT signature genes in TERT+/+, TERTVAA and TERT−/− groups with or without DSS treatment. e, A schematic representation of T-MAC identification. Cells highly expressing TERT signature genes among inflammatory macrophages are annotated as T-MACs and lowly expressing ones as non-T-MAC. f, The bar plot shows the proportion of T-MAC and non-T-MAC cells in inflammatory macrophages of TERT+/+, TERTVAA and TERT−/− groups with or without DSS treatment. g, The list of transcription factors (TF) enriched in controlling DEGs that are downregulated in TERT−/− T-MAC cells than the TERT+/+ T-MACs upon DSS treatment. P values were calculated by two-sided Fisher exact test. h, The list of enriched pathways based on the upregulated genes in DSS-treated TERT+/+ T-MACs compared with untreated TERT+/+ T-MACs. P values were calculated by two-sided Fisher exact test. P values for a: UT-TERT+/+-versus-UT-TERT−/−, P = 2.872 × 10⁻⁴; DSS-TERT+/+-versus-DSS-TERT−/−, P = 2.174 × 10⁻¹⁴. Panels b and e created with BioRender.com. Source numerical data are available in Source data.