
Fig. 3
- ID
- ZDB-FIG-250828-3
- Publication
- Akincilar et al., 2025 - Evolutionarily conserved role of telomerase reverse transcriptase in programming the microenvironment via regulation of the cGAS-STING pathway
- Other Figures
- All Figure Page
- Back to All Figure Page
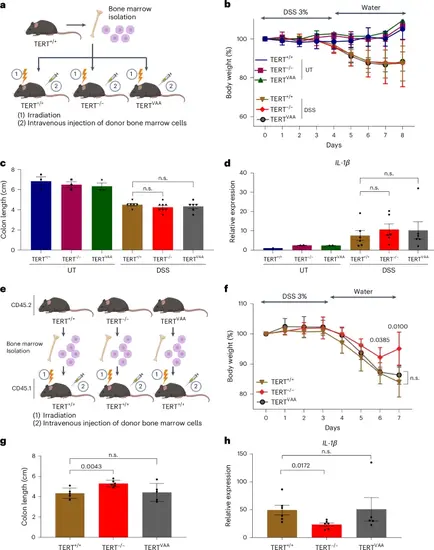
Immune cells are the primary cell type of the observed immunoregulatory roles of TERT. a, TERT+/+ bone marrow reconstituted TERT+/+, TERTVAA and TERT−/− mice treated with or without DSS for 8 days. b, The graph shows body weight measurements for each group. Error bars indicate the mean ± s.d. of two independent experiments (n = 3 for UT TERT+/+, n = 2 for UT TERT−/−, n = 2 for UT TERTVAA, n = 8 for DSS-treated groups). c, Colon lengths were measured on day 8. Error bars indicate the mean ± s.e.m. of two independent experiments (n = 6 for DSS TERT+/+, n = 8 for DSS TERT−/−, n = 6 for DSS TERTVAA). d, The graph shows the gene expression of IL-1β in colon tissues of TERT+/+ bone marrow reconstituted TERT+/+, TERTVAA and TERT−/− mice treated with or without DSS at day 8. Error bars indicate the mean ± s.e.m. of two independent experiments (n = 2 for UT TERT+/+, n = 2 for UT TERT−/−, n = 2 for UT TERTVAA, n = 6 for DSS-treated groups). e, Bone marrow transplantation from CD45.2 TERT+/+, TERT−/− and TERTVAA into CD45.1 TERT+/+ mice. f, The body weight change of recipient mice during the DSS experiment shown for each day. Error bars indicate the mean ± s.d. of two independent experiments (n = 5) (n.s., not significant). g, The colon length of DSS-treated CD45.2+ recipient mice measured. Error bars indicate the mean ± s.e.m. of two independent experiments (n = 5 for DSS TERT+/+, n = 6 for TERT−/−, n = 5 for DSS TERTVAA). h, The RNA level of IL-1β is shown as bar plots for TERT+/+ mice transplanted with TERT+/+, TERT−/− and TERTVAA bone marrow. Error bars indicate the mean ± s.e.m. of two independent experiments (n = 6 for with TERT+/+ and TERT−/−, n = 5 for TERTVAA). Actin was used as a normalizing control. P values were calculated by unpaired two-sided Student’s t-test (n.s., not significant). P values for f: DSS TERT+/+-versus-DSS TERT−/−, day 6 P = 0.0385; day 7, P = 0.01; g: DSS TERT+/+-versus-DSS TERT−/−, P = 0.0043. Panels a and e created with BioRender.com. Source numerical data are available in Source data. |