
Fig. 6
- ID
- ZDB-FIG-250828-6
- Publication
- Akincilar et al., 2025 - Evolutionarily conserved role of telomerase reverse transcriptase in programming the microenvironment via regulation of the cGAS-STING pathway
- Other Figures
- All Figure Page
- Back to All Figure Page
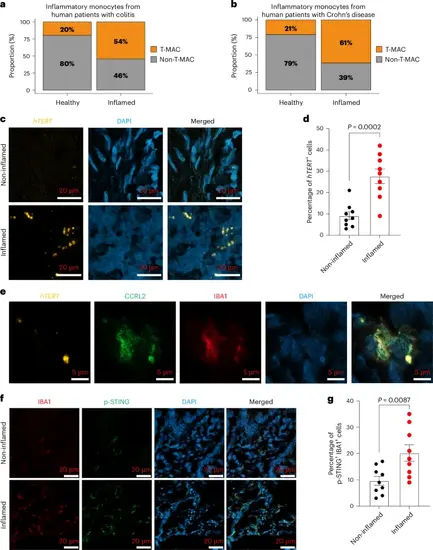
T-MACs drive human colitis. a, Bar plots show the proportion of T-MAC and non-T-MAC cells in inflammatory monocytes of healthy controls and and patients with colitis (a) and in monocytes of healthy controls and patients with Crohn’s disease (b). c, RNAscope-based in situ hybridization assay showing hTERT expression in non-inflamed and inflamed colon tissues from patients with ulcerative colitis. d, Quantification of hTERT+ cells in non-inflamed and inflamed colon tissues from three patients with ulcerative colitis. n = 3 (three fields for each sample). Error bars indicate the mean ± s.e.m. P values were calculated using unpaired, two-sided Student’s t-test method. e, In situ hybridization (RNAscope) assay for hTERT followed by sequential immunofluorescence of T-MAC marker (CCRL2) and macrophage marker (IBA1) in inflamed colon tissue from patients with ulcerative colitis. DAPI was used as a nuclear counterstain. f, Immunofluorescence staining of IBA1 and p-STING in non-inflamed and inflamed colon tissues from patients with ulcerative colitis. g, Quantification of IBA1+p-STING+ cells in non-inflamed and inflamed colon tissues from three patients with ulcerative colitis. n = 3 (three fields for each sample). Error bars indicate the mean ± s.e.m. P values were calculated using unpaired, two-sided Student’s t-test method. P values for d: non-inflamed-versus-inflamed, P = 0.0002; g: non-inflamed-versus-inflamed, P = 0.0087. Source numerical data are available in Source data. |