
Fig. 7
- ID
- ZDB-FIG-250828-7
- Publication
- Akincilar et al., 2025 - Evolutionarily conserved role of telomerase reverse transcriptase in programming the microenvironment via regulation of the cGAS-STING pathway
- Other Figures
- All Figure Page
- Back to All Figure Page
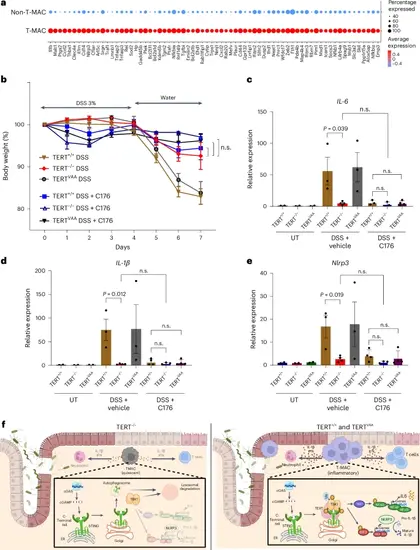
Therapeutic targeting of TERT-mediated activation of T-MACs reverses colitis. a, DEGs are shown between mouse T-MAC and non-T-MAC cells. b, The graph shows percentage changes in body weight of the DSS-treated TERT+/+, TERTVAA and TERT−/− mice with or without STING inhibitor (n = 5). Error bars indicate the mean ± s.d. P values were calculated by unpaired, two-sided Student’s t-test. c–e, The expression of IL-6 (c), IL-1β (d) and Nlrp3 (e) genes was analysed by RT-qPCR. Error bars indicate the mean ± s.e.m. P values were calculated by the unpaired, two-sided Student’s t-test method (n.s., not significant) (n = 2 for UT samples, n = 3 for DSS TERT+/+, TERTVAA and DSS + C176 TERT+/+, TERT−/−, n = 4 for DSS TERT+/+ and DSS + C176 TERTVAA. f, The model shows the activation of inflammatory T-MACs via the cGAS–STING pathway. Left: in the absence of TERT, T-MACs exhibit a diminished inflammatory response due to impaired STING–TBK1 interaction and alleviated kinase activity of TBK1. Right: in TERT+/+ and TERTVAA mice, TERT forms a ternary complex with STING and TBK1, enhancing TBK1 autophosphorylation. Subsequently activated TBK1 phosphorylates STING. This leads to expansion and activation of T-MACs and induces expression of type 1 IFN and NFκB genes. P values for c: DSS+vehicle TERT+/+-versus-DSS+vehicle TERT−/−, P = 0.039; d: DSS+vehicle TERT+/+-versus-DSS+vehicle TERT−/−, P = 0.012; e: DSS+vehicle TERT+/+-versus-DSS+vehicle TERT−/−, P = 0.019. Panel f created with BioRender.com. Source numerical data are available in Source data. |