
Fig. 2
- ID
- ZDB-FIG-250828-2
- Publication
- Akincilar et al., 2025 - Evolutionarily conserved role of telomerase reverse transcriptase in programming the microenvironment via regulation of the cGAS-STING pathway
- Other Figures
- All Figure Page
- Back to All Figure Page
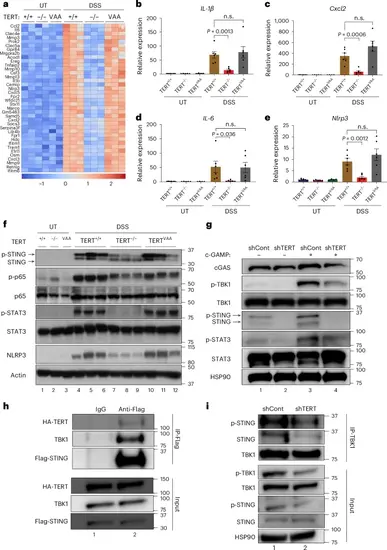
TERT regulates the expression of inflammatory genes. a, The heat map shows the gene expression differences in the colon tissues of TERT+/+, TERTVAA and TERT−/− mice treated with or without DSS at day 8 by RNA-seq (n = 2 for untreated, n = 3 for DSS-treated samples). b–e, The expression of IL-1β (b), Cxcl2 (c), IL-6 (d) and Nlrp3 (e) genes were analysed by RT-qPCR from the colon tissues of TERT+/+, TERTVAA and TERT−/− mice treated with or without DSS at day 8 (n = 7 for UT TERT+/+, n = 5 for UT TERT−/−, n = 4 for UT TERTVAA, n = 6 for each DSS group). Data were normalized to actin. f, The western blot shows the expression of STING (phosphorylated form in the top band, total in the bottom band), phospho-p65, p65, p-STAT3, STAT3 and NLRP3 (n = 3). Actin was used as a loading control. g, THP1 cells stably expressing shCont and shTERT plasmids were treated with c-GAMP for 4 h and analysed for the indicated proteins by western blot. HSP90 was used as a loading control. h, Cells were transfected with HA-TERT and Flag-STING plasmids. Forty-eight hours after transfection, cells were treated with c-GAMP for 4 h, and lysates were incubated with IgG or anti-FLAG antibodies. STING was immunoprecipitated using Protein G sepharose beads. Immunoprecipitants (IP) were probed for HA-TERT, TBK1 and Flag-STING proteins by western blot. i, TBK1 was immunoprecipitated from the c-GAMP-treated shCont and shTERT cells and analysed for the indicated proteins by western blot. HSP90 was used as a loading control. In g and i, representative blots are from two independent experiments. Error bars indicate the mean ± s.e.m. P values were calculated by unpaired two-sided Student’s t-test (n.s., not significant). P values for b: DSS TERT+/+-versus-DSS TERT−/−, P = 0.0013; c: DSS TERT+/+-versus-DSS TERT−/−, P = 0.0006; d: DSS TERT+/+-versus-DSS TERT−/−, P = 0.0036; e: DSS TERT+/+-versus-DSS TERT−/−, P = 0.0012. Source numerical data and unprocessed blots are available in Source data. |