
|
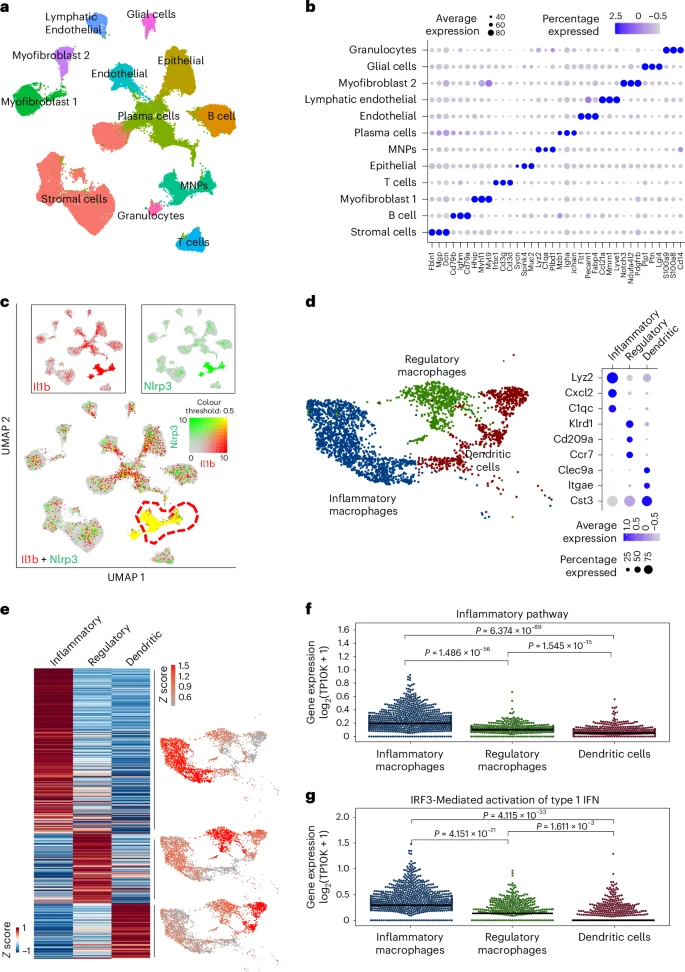
Fig. 4 TERT regulates the expression of inflammatory response genes in myeloid cells. a, A UMAP plot of cells from mice colon tissues based on single-cell RNA seq. b, The bubble plot shows the cell-type-specific markers for each cluster in a. c, The expression of IL-1β and Nlrp3 genes is shown in cell clusters identified in a. Red and green colours indicate IL-1β and Nlrp3 gene expression, respectively. Yellow colour shows the co-expression in MNPs. d, UMAP of MNP subclusters (left) and expression of cluster specific markers (right). e, The heat map shows the DEGs between inflammatory macrophages, regulatory macrophages and dendritic cells (left). UMAP shows the average expression level of the DEGs for each cluster (right). f,g, Swarm plots show the average expression of the inflammatory pathway (f) and IRF3-mediated activation of type 1 IFN signature genes (g) for indicated cell types. Inflammatory macrophages n = 1,593, regulatory macrophages n = 626, dendritic cells n = 737. The line indicates the median expression. P values were calculated by two-sided Mann–Whitney test (n.s., not significant). P values for f: inflammatory-versus-regulatory macrophages, P = 1.486 × 10−56; regulatory macrophages-versus-dendritic cells, P = 1.545 × 10⁻¹⁵; inflammatory macrophages-versus-dendritic cells, P = 6.374 × 10−89; g: inflammatory-versus-regulatory macrophages, P = 4.151 × 10⁻²¹; inflammatory macrophages-versus-dendritic cells, P = 4.115 × 10⁻³³; regulatory macrophages-versus-dendritic cells, P = 1.611 × 10⁻³. Source numerical data are available in Source data.