FIGURE SUMMARY
Title

In vivo measurement of an Apelin gradient with a genetically encoded APLNR conformation biosensor

Authors
Herdt, L., Schihada, H., Kurz, M., Ernst, S., Eberlein, J., Kolb, P., Krasel, C., Bünemann, M., Helker, C.S.M.
Source
Full text @ Nat. Commun.

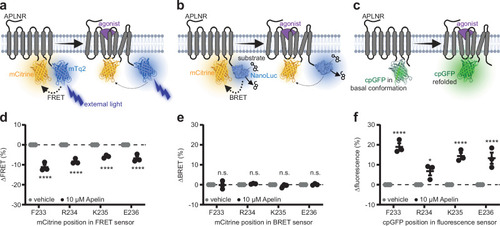
APLNR conformational biosensor design and validation.

Schematic illustration of the APLNR conformational biosensors design based on FRET (a), BRET (b) and cpGFP (c). mCitrine (FRET and BRET) and cpGFP were integrated at four different positions in the intracellular loop domain 3 of the APLNR (F233, R234, K235 and E236). df Functionality validation of the different biosensor variants stimulated with 10 µM Apelin in HEK293 cells. All four FRET biosensor variants show a significant FRET ratio decrease of around 10% after Apelin stimulation (d). In contrast, none of the BRET biosensors show a change in the BRET ratio after Apelin stimulation (e). All four cpGFP biosensor variants show a significant increase in the biosensor fluorescence intensity after Apelin stimulation (f). Data in (d) presented as mean ± StD from three transiently transfected single HEK293T cells. Data in (e, f) are presented as mean values ± SEM from three independent experiments conducted in transiently transfected HEK293A cells. Statistical analysis was performed by using a 2-way ANOVA followed by Šidák’s multiple comparison correction (*p < 0.0332; ****p < 0.0001). mTq2 mTurquoise2, FRET Förster resonance energy transfer, BRET bioluminescence resonance energy transfer, cpGFP circularly permuted GFP, HEK293 human embryonic kidney 293, n.s. not significant. Source data are provided as a Source Data file. ac Created in BioRender. Schihada (2025) https://BioRender.com/e05s6eo.

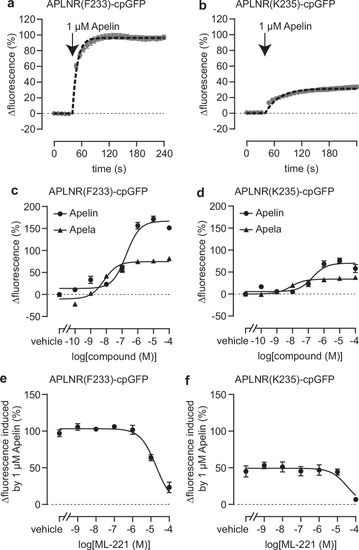
Pharmacological characterization of the APLNR-cpGFP biosensors.

Stimulation with Apelin and Apela (arrow indicates timepoint of ligand addition) led to a significant increase of APLNR(F233)-cpGFP (a, c) and APLNR(K235)-cpGFP (b, d) biosensor fluorescent intensity. The APLNR antagonist ML-221 significantly diminished the Apelin-induced fluorescent response of APLNR(F233)-cpGFP (e) and APLNR(K235)-cpGFP (f). Data are presented as mean values ± SEM from three independent experiments conducted in stable APLNR-cpGFP expressing HEK293T cells. cpGFP circularly permuted GFP, HEK293T human embryonic kidney 293T. Source data are provided as a Source Data file.

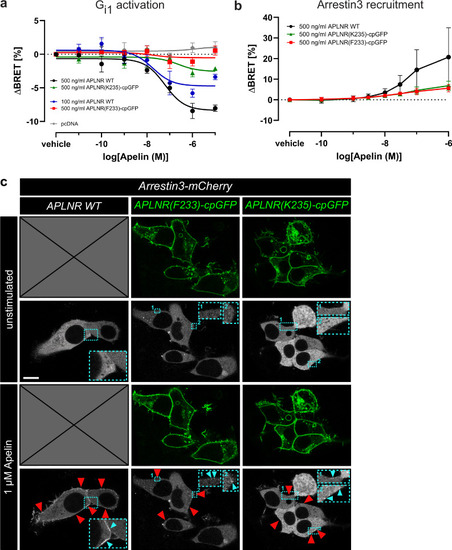
APLNR-cpGFP biosensors possess signaling ability.

Gi1 protein dissociation (a) and Arrestin3 recruitment (b) BRET assay of APLNR wildtype (WT), APLNR(F233)-cpGFP, and APLNR(K235)-cpGFP after Apelin stimulation. ng/ml represents the amount of receptor plasmid DNA (ng) used to transfect one ml of cells. c HEK293 cells were transiently transfected with Arrestin3-mCherry together with either APLNR WT, APLNR(F233)-cpGFP or APLNR(K235)-cpGFP. Cytoplasmic Arrestin3-mCherry localization is observed in unstimulated conditions. Apelin stimulation leads to a substantial translocation of Arrestin3-mCherry in APLNR WT co-transfected HEK293 cells. In contrast, only a minor fraction of Arrestin3-mCherry is membrane-localized when co-transfected with either APLNR(F233)-cpGFP or APLNR(K235)-cpGFP after Apelin stimulation. Arrowheads indicate membrane-localized Arrestin3-mCherry. Data are presented as mean values ± SEM from three independent experiments (a) and ±StD from four independent experiments (b) conducted in transiently transfected HEK293A cells (a) or transiently transfected HEK293T cells (b, c). cpGFP circularly permuted GFP, HEK293 human embryonic kidney 293. Source data are provided as a Source Data file.

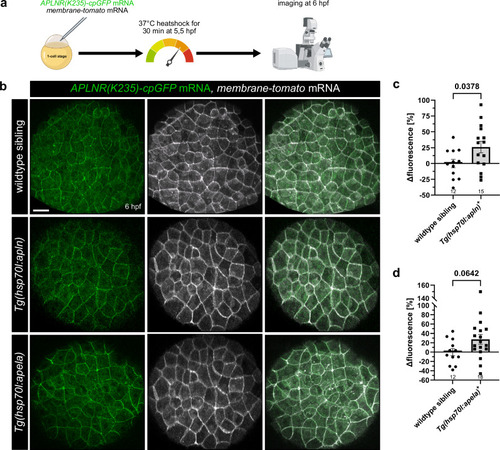
Ubiquitous Apelin and Apela overexpression activate APLNR(K235)-cpGFP biosensor in vivo.

a Schematic illustration of the procedure. APLNR(K235)-cpGFP and membrane-tomato mRNA were injected into 1-cell stage zebrafish embryos. At 5.5 hours post-fertilization (hpf), injected embryos were heat shocked for 30 min at 37 °C to induce ubiquitous ligand overexpression and subsequently imaged at 6 hpf. b Representative confocal projection images of an injected wildtype sibling and transgenic Tg(hsp70l:apln) and Tg(hsp70l:apela) embryos at 6 hpf, respectively. Quantification of APLNR(K235)-cpGFP delta fluorescence intensity of wildtype siblings compared to embryos ubiquitously overexpressing the apln (c) and the apela (d) ligand. Each dot represents the mean of 10 measured cells per embryo. Data are presented as mean values ± SEM. (N number of embryos, n number of cells: c wildtype siblings N/n: 12/120, Tg(hsp70l:apln)+N/n: 15/150; d wildtype siblings N/n: 12/120, Tg(hsp70l:apela)+N/n: 18/180). Statistical analysis was performed by using a two-tailed unpaired Student’s t-test with Welch’s correction. Scale bars 30 µm. cpGFP circularly permuted GFP. Source data are provided as a Source Data file. a Created in BioRender. Schihada (2025) https://BioRender.com/vqh3y8e.

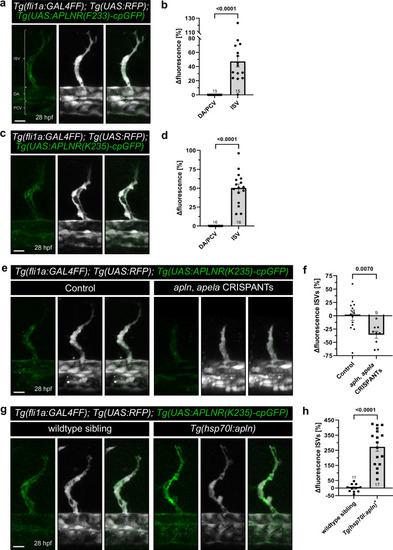
APLNR-cpGFP biosensors visualize endogenous Aplnr activity in vivo.

a Representative confocal projection images of blood vessels in the trunk of triple transgenic Tg(fli1a:GAL4FF); Tg(UAS:RFP); Tg(UAS:APLNR(F233)-cpGFP) zebrafish embryos at 28 hours post-fertilization (hpf). b Quantification of APLNR(F233)-cpGFP delta fluorescence of ISVs compared to the DA/PCV. Each dot represents the mean of five analyzed ISVs per embryo or of the DA/PCV. c Representative confocal projection images of blood vessels in the trunk of triple transgenic Tg(fli1a:GAL4FF); Tg(UAS:RFP); Tg(UAS:APLNR(K235)-cpGFP) zebrafish embryos at 28 hpf. d Quantification of APLNR(K235)-cpGFP delta fluorescence intensity of ISVs compared to the DA/PCV. Each dot represents the mean of five analyzed ISVs per embryo or of the DA/PCV. e Representative confocal projection images of blood vessels in the trunk of triple transgenic Tg(fli1a:GAL4FF); Tg(UAS:RFP); Tg(UAS:APLNR(K235)-cpGFP) zebrafish embryos injected with apln, apela CRISPANTs at 28 hpf. f Quantification of APLNR(K235)-cpGFP delta fluorescence of ISVs in apln, apela CRISPANTs compared to control siblings. Each dot represents the mean of up to five analyzed ISVs per embryo. g Representative confocal projection images of blood vessels in the trunk of Tg(fli1a:GAL4FF); Tg(UAS:RFP); Tg(UAS:APLNR(K235)-cpGFP); Tg(hsp70l:apln) zebrafish embryos at 28 hpf. h Quantification of APLNR(K235)-cpGFP delta fluorescence of ISVs in Apelin ligand overexpression Tg(hsp70l:apln) embryos compared to control wildtype siblings. Each dot represents the mean of five analyzed ISVs per embryo. Data are presented as mean values ± SEM. (N number of embryos, n either ISVs or DA/PCV: b DA/PCV N/n: 15/15, ISV N/n: 15/75; d DA/PCV N/n: 16/16, ISV N/n: 16/80; f Control: DA/PCV N/n: 13/13, ISV N/n: 13/65; apln, apela CRISPANTs: DA/PCV N/n: 9/9, ISV N/n: 9/38; h wildtype siblings: DA/PCV N/n: 11/11, ISV N/n: 11/55; Tg(hsp70l:apln): DA/PCV N/n: 17/17, ISV N/n: 17/85). Statistical analysis was performed by using a two-tailed unpaired Student’s t-test with Welch’s correction. Scale bars 15 µm. cpGFP circularly permuted GFP, ISV intersegmental vessel, DA dorsal aorta, PCV posterior cardinal vein.

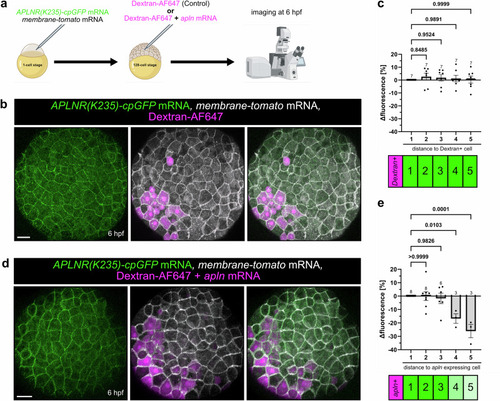
Measuring an Apelin ligand gradient in vivo.

a Schematic illustration of the experiment. APLNR(K235)-cpGFP and membrane-tomato mRNA were injected into 1-cell stage zebrafish embryos. At the 128-cell stage, Dextran-AF647 or apln mRNA together with Dextran-AF647 were injected intracellularly in single blastomeres. Embryos were imaged at 6 hours post-fertilization (hpf). Representative confocal projection image of double-injected embryos with only Dextran-AF647 (b) or apln mRNA together with Dextran-AF647 (d) at 6 hpf. c, e Quantification of APLNR(K235)-cpGFP delta fluorescence intensity of single cells in relation to their distance to a Dextran positive cell (c) or an apln-expressing Dextran positive cell (e). Each dot represents the mean of cells with the same distance within an embryo. A distance of 1 indicates a direct neighbor cell of a Dextran-AF647 positive cell. Data are presented as mean values ± SEM. (N number of embryos, n number of cells; c 1 - N/n: 7/59, 2 - N/n: 7/54, 3 - N/n: 7/52, 4 - N/n: 7/51, 5 - N/n: 7/51; e 1 - N/n: 8/64, 2 - N/n: 8/50, 3 - N/n: 6/31, 4 - N/n: 3/14, 5 - N/n: 3/10). Statistical analysis was performed by using ordinary One-way ANOVA, followed by Dunnett’s multiple comparison correction. Scale bars 30 µm. cpGFP circularly permuted GFP, AF647 AlexaFluor647. Source data are provided as a Source Data file. a Created in BioRender. Schihada (2025) https://BioRender.com/hsvc4j3.

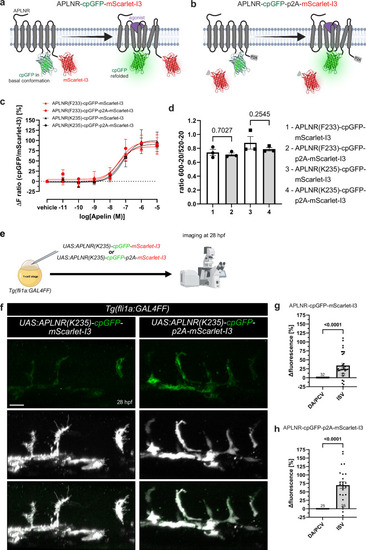
Development and in vivo application of ratiometric APLNR-cpGFP-mScarlet-I3 biosensors.

a, b Schematic illustration of the ratiometric APLNR conformational biosensors design. mScarlet-I3 and p2A-mScarlet-I3 were integrated C-terminally into the APLNR-cpGFP biosensors, resulting in membrane-bound (a) and cytosolic (b) mScarlet-I3 localization. c HEK293A cells were transiently transfected with the respective ratiometric biosensor plasmid and stimulated with Apelin. Stimulation with Apelin led to a strong increase in cpGFP over mScarlet-I3 fluorescence intensity of each ratiometric biosensor variant. d Quantification of the FRET ratio of the ratiometric biosensor with and without a p2A self-cleaving peptide exhibited no significant differences, indicating that cpGFP and mScarlet-I3 are no FRET partner. e Schematic illustration of the procedure. Plasmids encoding either UAS:APLNR(K235)-cpGFP-mScarlet-I3 or UAS:APLNR(K235)-cpGFP-p2A-mScarlet-I3 were injected into 1-cell stage Tg(fli1a:GAL4FF) zebrafish embryos and imaged at 28 hours post fertilization (hpf). f, g Quantification of APLNR(K235)-cpGFP over mScarlet-I3 fluorescence intensities in ISVs compared to the DA and PCV in UAS:APLNR(K235)-cpGFP-mScarlet-I3 (g) or UAS:APLNR(K235)-cpGFP-p2A-mScarlet-I3 (h) injected embryos at 28 hpf. Data in are presented as mean values ± SEM from three independent experiments conducted in transiently transfected HEK293A cells (c, d) or zebrafish embryos (N number of embryos, n either ISVs or DA/PCV: g DA/PCV N/n: 32/32, ISV N/n: 32/110; h DA/PCV N/n: 25/25, ISV N/n: 25/75). Statistical analysis was performed by using ordinary One-way ANOVA, followed Dunnett’s multiple comparison correction (d) and two-tailed unpaired Student’s t-test with Welch’s correction (g, h). Scale bars 50 µm. ISV intersegmental vessel, DA dorsal aorta, PCV posterior cardinal vein, hpf hours post-fertilization, cpGFP circularly permuted GFP, HEK293 human embryonic kidney 293. Source data are provided as a Source Data file. a, b Created in BioRender. Schihada (2025) https://BioRender.com/odhtcw2. e Created in BioRender. Schihada (2025) https://BioRender.com/mz23zor.

Acknowledgments
This image is the copyrighted work of the attributed author or publisher, and ZFIN has permission only to display this image to its users. Additional permissions should be obtained from the applicable author or publisher of the image. Full text @ Nat. Commun.