|
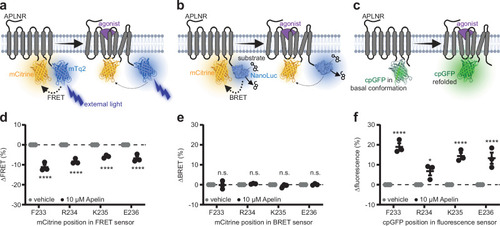
APLNR conformational biosensor design and validation. Schematic illustration of the APLNR conformational biosensors design based on FRET (a), BRET (b) and cpGFP (c). mCitrine (FRET and BRET) and cpGFP were integrated at four different positions in the intracellular loop domain 3 of the APLNR (F233, R234, K235 and E236). d–f Functionality validation of the different biosensor variants stimulated with 10 µM Apelin in HEK293 cells. All four FRET biosensor variants show a significant FRET ratio decrease of around 10% after Apelin stimulation (d). In contrast, none of the BRET biosensors show a change in the BRET ratio after Apelin stimulation (e). All four cpGFP biosensor variants show a significant increase in the biosensor fluorescence intensity after Apelin stimulation (f). Data in (d) presented as mean ± StD from three transiently transfected single HEK293T cells. Data in (e, f) are presented as mean values ± SEM from three independent experiments conducted in transiently transfected HEK293A cells. Statistical analysis was performed by using a 2-way ANOVA followed by Šidák’s multiple comparison correction (*p < 0.0332; ****p < 0.0001). mTq2 mTurquoise2, FRET Förster resonance energy transfer, BRET bioluminescence resonance energy transfer, cpGFP circularly permuted GFP, HEK293 human embryonic kidney 293, n.s. not significant. Source data are provided as a Source Data file. a–c Created in BioRender. Schihada (2025) https://BioRender.com/e05s6eo.
|