|
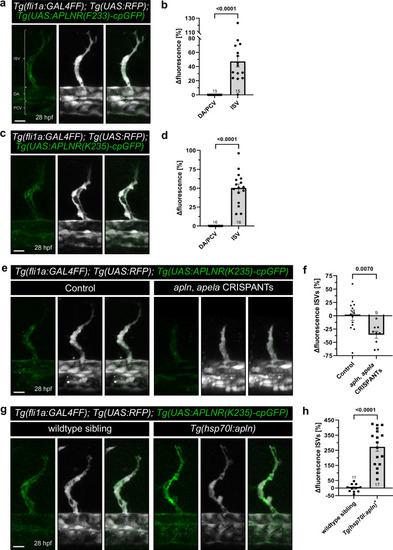
APLNR-cpGFP biosensors visualize endogenous Aplnr activity in vivo. a Representative confocal projection images of blood vessels in the trunk of triple transgenic Tg(fli1a:GAL4FF); Tg(UAS:RFP); Tg(UAS:APLNR(F233)-cpGFP) zebrafish embryos at 28 hours post-fertilization (hpf). b Quantification of APLNR(F233)-cpGFP delta fluorescence of ISVs compared to the DA/PCV. Each dot represents the mean of five analyzed ISVs per embryo or of the DA/PCV. c Representative confocal projection images of blood vessels in the trunk of triple transgenic Tg(fli1a:GAL4FF); Tg(UAS:RFP); Tg(UAS:APLNR(K235)-cpGFP) zebrafish embryos at 28 hpf. d Quantification of APLNR(K235)-cpGFP delta fluorescence intensity of ISVs compared to the DA/PCV. Each dot represents the mean of five analyzed ISVs per embryo or of the DA/PCV. e Representative confocal projection images of blood vessels in the trunk of triple transgenic Tg(fli1a:GAL4FF); Tg(UAS:RFP); Tg(UAS:APLNR(K235)-cpGFP) zebrafish embryos injected with apln, apela CRISPANTs at 28 hpf. f Quantification of APLNR(K235)-cpGFP delta fluorescence of ISVs in apln, apela CRISPANTs compared to control siblings. Each dot represents the mean of up to five analyzed ISVs per embryo. g Representative confocal projection images of blood vessels in the trunk of Tg(fli1a:GAL4FF); Tg(UAS:RFP); Tg(UAS:APLNR(K235)-cpGFP); Tg(hsp70l:apln) zebrafish embryos at 28 hpf. h Quantification of APLNR(K235)-cpGFP delta fluorescence of ISVs in Apelin ligand overexpression Tg(hsp70l:apln) embryos compared to control wildtype siblings. Each dot represents the mean of five analyzed ISVs per embryo. Data are presented as mean values ± SEM. (N number of embryos, n either ISVs or DA/PCV: b DA/PCV N/n: 15/15, ISV N/n: 15/75; d DA/PCV N/n: 16/16, ISV N/n: 16/80; f Control: DA/PCV N/n: 13/13, ISV N/n: 13/65; apln, apela CRISPANTs: DA/PCV N/n: 9/9, ISV N/n: 9/38; h wildtype siblings: DA/PCV N/n: 11/11, ISV N/n: 11/55; Tg(hsp70l:apln): DA/PCV N/n: 17/17, ISV N/n: 17/85). Statistical analysis was performed by using a two-tailed unpaired Student’s t-test with Welch’s correction. Scale bars 15 µm. cpGFP circularly permuted GFP, ISV intersegmental vessel, DA dorsal aorta, PCV posterior cardinal vein.
|