IMAGE

Fig. 5

ID
ZDB-IMAGE-250724-42
Source
Figures for Herdt et al., 2025
Image
Figure Caption

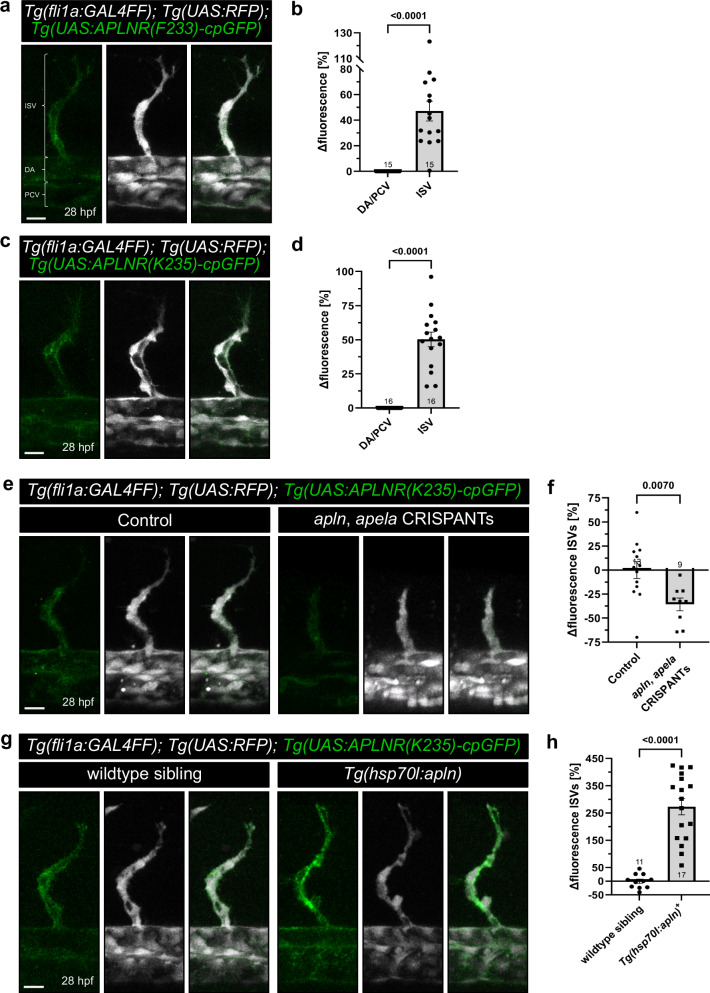
Fig. 5 APLNR-cpGFP biosensors visualize endogenous Aplnr activity in vivo.

a Representative confocal projection images of blood vessels in the trunk of triple transgenic Tg(fli1a:GAL4FF); Tg(UAS:RFP); Tg(UAS:APLNR(F233)-cpGFP) zebrafish embryos at 28 hours post-fertilization (hpf). b Quantification of APLNR(F233)-cpGFP delta fluorescence of ISVs compared to the DA/PCV. Each dot represents the mean of five analyzed ISVs per embryo or of the DA/PCV. c Representative confocal projection images of blood vessels in the trunk of triple transgenic Tg(fli1a:GAL4FF); Tg(UAS:RFP); Tg(UAS:APLNR(K235)-cpGFP) zebrafish embryos at 28 hpf. d Quantification of APLNR(K235)-cpGFP delta fluorescence intensity of ISVs compared to the DA/PCV. Each dot represents the mean of five analyzed ISVs per embryo or of the DA/PCV. e Representative confocal projection images of blood vessels in the trunk of triple transgenic Tg(fli1a:GAL4FF); Tg(UAS:RFP); Tg(UAS:APLNR(K235)-cpGFP) zebrafish embryos injected with apln, apela CRISPANTs at 28 hpf. f Quantification of APLNR(K235)-cpGFP delta fluorescence of ISVs in apln, apela CRISPANTs compared to control siblings. Each dot represents the mean of up to five analyzed ISVs per embryo. g Representative confocal projection images of blood vessels in the trunk of Tg(fli1a:GAL4FF); Tg(UAS:RFP); Tg(UAS:APLNR(K235)-cpGFP); Tg(hsp70l:apln) zebrafish embryos at 28 hpf. h Quantification of APLNR(K235)-cpGFP delta fluorescence of ISVs in Apelin ligand overexpression Tg(hsp70l:apln) embryos compared to control wildtype siblings. Each dot represents the mean of five analyzed ISVs per embryo. Data are presented as mean values ± SEM. (N number of embryos, n either ISVs or DA/PCV: b DA/PCV N/n: 15/15, ISV N/n: 15/75; d DA/PCV N/n: 16/16, ISV N/n: 16/80; f Control: DA/PCV N/n: 13/13, ISV N/n: 13/65; apln, apela CRISPANTs: DA/PCV N/n: 9/9, ISV N/n: 9/38; h wildtype siblings: DA/PCV N/n: 11/11, ISV N/n: 11/55; Tg(hsp70l:apln): DA/PCV N/n: 17/17, ISV N/n: 17/85). Statistical analysis was performed by using a two-tailed unpaired Student’s t-test with Welch’s correction. Scale bars 15 µm. cpGFP circularly permuted GFP, ISV intersegmental vessel, DA dorsal aorta, PCV posterior cardinal vein.

Acknowledgments
This image is the copyrighted work of the attributed author or publisher, and ZFIN has permission only to display this image to its users. Additional permissions should be obtained from the applicable author or publisher of the image. Full text @ Nat. Commun.