|
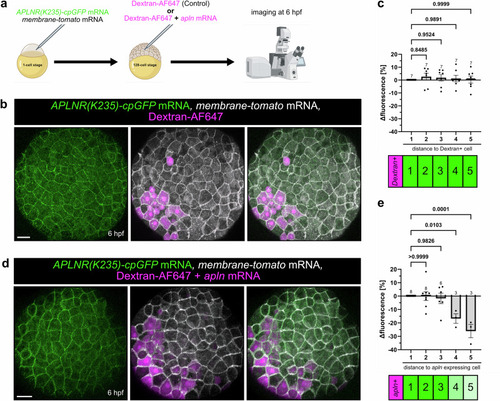
Measuring an Apelin ligand gradient in vivo. a Schematic illustration of the experiment. APLNR(K235)-cpGFP and membrane-tomato mRNA were injected into 1-cell stage zebrafish embryos. At the 128-cell stage, Dextran-AF647 or apln mRNA together with Dextran-AF647 were injected intracellularly in single blastomeres. Embryos were imaged at 6 hours post-fertilization (hpf). Representative confocal projection image of double-injected embryos with only Dextran-AF647 (b) or apln mRNA together with Dextran-AF647 (d) at 6 hpf. c, e Quantification of APLNR(K235)-cpGFP delta fluorescence intensity of single cells in relation to their distance to a Dextran positive cell (c) or an apln-expressing Dextran positive cell (e). Each dot represents the mean of cells with the same distance within an embryo. A distance of 1 indicates a direct neighbor cell of a Dextran-AF647 positive cell. Data are presented as mean values ± SEM. (N number of embryos, n number of cells; c 1 - N/n: 7/59, 2 - N/n: 7/54, 3 - N/n: 7/52, 4 - N/n: 7/51, 5 - N/n: 7/51; e 1 - N/n: 8/64, 2 - N/n: 8/50, 3 - N/n: 6/31, 4 - N/n: 3/14, 5 - N/n: 3/10). Statistical analysis was performed by using ordinary One-way ANOVA, followed by Dunnett’s multiple comparison correction. Scale bars 30 µm. cpGFP circularly permuted GFP, AF647 AlexaFluor647. Source data are provided as a Source Data file. a Created in BioRender. Schihada (2025) https://BioRender.com/hsvc4j3.
|