IMAGE

Fig. 6

ID
ZDB-IMAGE-250724-43
Source
Figures for Herdt et al., 2025
Image
Figure Caption

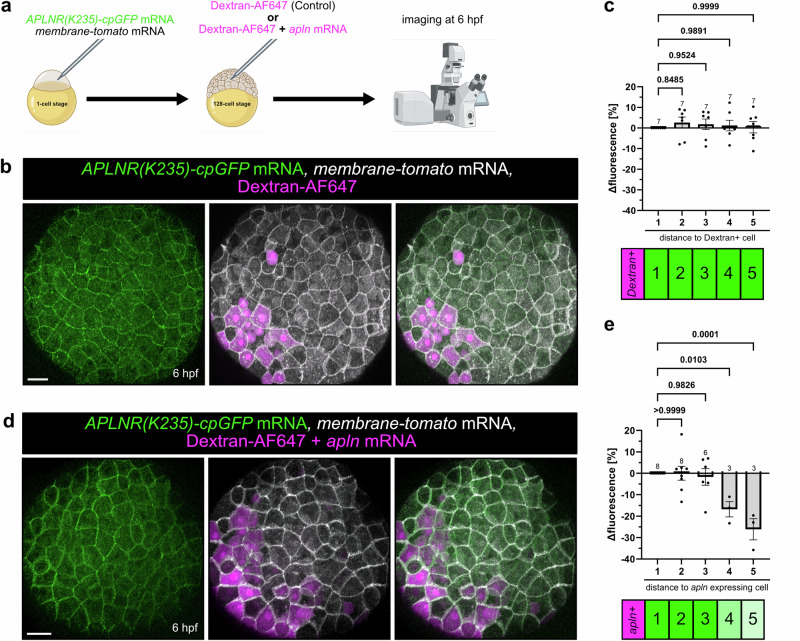
Fig. 6 Measuring an Apelin ligand gradient in vivo.

a Schematic illustration of the experiment. APLNR(K235)-cpGFP and membrane-tomato mRNA were injected into 1-cell stage zebrafish embryos. At the 128-cell stage, Dextran-AF647 or apln mRNA together with Dextran-AF647 were injected intracellularly in single blastomeres. Embryos were imaged at 6 hours post-fertilization (hpf). Representative confocal projection image of double-injected embryos with only Dextran-AF647 (b) or apln mRNA together with Dextran-AF647 (d) at 6 hpf. c, e Quantification of APLNR(K235)-cpGFP delta fluorescence intensity of single cells in relation to their distance to a Dextran positive cell (c) or an apln-expressing Dextran positive cell (e). Each dot represents the mean of cells with the same distance within an embryo. A distance of 1 indicates a direct neighbor cell of a Dextran-AF647 positive cell. Data are presented as mean values ± SEM. (N number of embryos, n number of cells; c 1 - N/n: 7/59, 2 - N/n: 7/54, 3 - N/n: 7/52, 4 - N/n: 7/51, 5 - N/n: 7/51; e 1 - N/n: 8/64, 2 - N/n: 8/50, 3 - N/n: 6/31, 4 - N/n: 3/14, 5 - N/n: 3/10). Statistical analysis was performed by using ordinary One-way ANOVA, followed by Dunnett’s multiple comparison correction. Scale bars 30 µm. cpGFP circularly permuted GFP, AF647 AlexaFluor647. Source data are provided as a Source Data file. a Created in BioRender. Schihada (2025) https://BioRender.com/hsvc4j3.

Acknowledgments
This image is the copyrighted work of the attributed author or publisher, and ZFIN has permission only to display this image to its users. Additional permissions should be obtained from the applicable author or publisher of the image. Full text @ Nat. Commun.