
- Title
-
IL-23 Receptor Agonism by Mulberroside C Activates the RASGRP1/RAS/ERK Pathway Contributing to Leukopenia Treatments
- Authors
- Zhang, L.W., Liu, Y.Z., Li, T.C., Li, J.Y., Yan, X.Y., Liu, Z.X., Li, L.Y., Shen, H.P., Zou, W.J., Wu, J.M.
- Source
- Full text @ Phytother. Res.
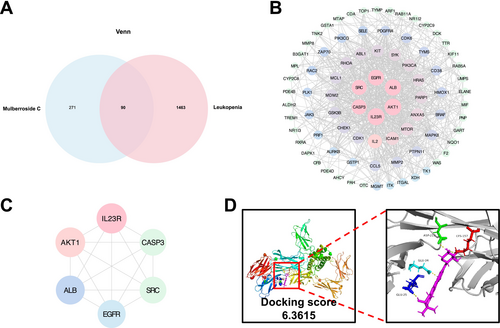
Identification of Mulberroside C (MC) targets in leukopenia through network pharmacology and molecular docking analysis. (A) A Venn diagram illustrating the overlapping targets of MC and leukopenia. (B) The MC-target-leukopenia interaction network in Cytoscape v3.7.1. (C) Protein–protein interaction (PPI) network highlighting the core targets of MC in combating leukopenia. (D) The binding affinity of MC with its core target, IL-23 receptor (IL23R). |
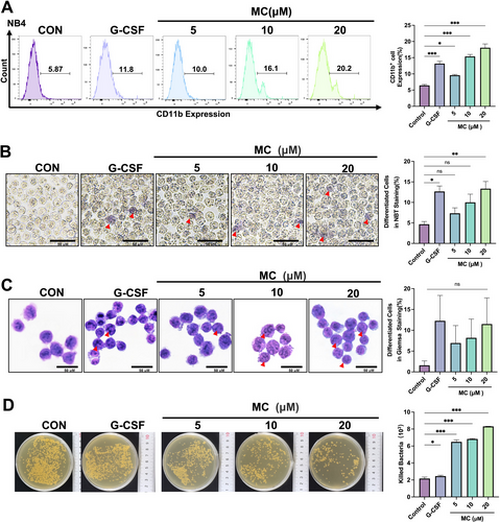
Mulberroside C (MC) promotes neutrophil differentiation and enhances bactericidal activity in vitro. (A) Effect of MC (5–20 μM) or granulocyte colony-stimulating factor (G-CSF, 25 μg/kg) on CD11b expression in NB4 cells. The histogram shows CD11b+ cell percentages per group. n = 3. (B) Effect of MC (5–20 μM) or G-CSF (25 μg/kg) on NB4 cell differentiation as assessed by NBT reduction assay for 5 days. Red arrows indicate differentiated cells (scale bar, 50 μm). n = 3. (C) Effect of MC (5–20 μM) or G-CSF (25 μg/kg) on NB4 differentiation by Giemsa staining for 5 days. Red arrows indicate differentiated cells (scale bar, 50 μm) n = 3. (D) Effect of MC (5–20 μM) or G-CSF (25 μg/kg) on bactericidal activity. Histograms show bacterial counts killed per group. n = 3. Data are expressed as the mean ± SEM. *p < 0.05; **p < 0.01; ***p < 0.001 versus the control group. ns = no significance. |
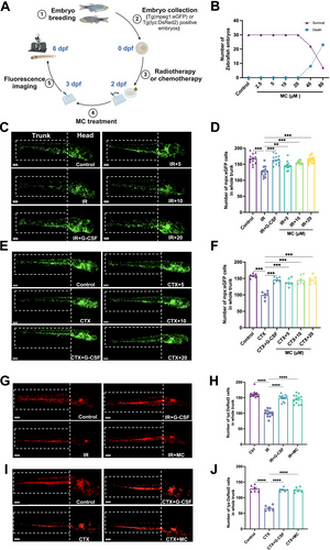
Effects of Mulberroside C (MC) on leukopenia in zebrafish. (A) Timeline of the zebrafish intervention protocol. Effect of granulocyte colony-stimulating factor (G-CSF, 25 μg/L) or MC (5–20 μM) in irradiated or cyclophosphamide-treated transgenic zebrafish Tg(mpeg1: EGFP) and Tg(lyz: DsRed). (B) Toxicity of MC (2.5–80 μM) on zebrafish survival and development at 2 days postfertilization (2 dpf). n = 30. (C) Fluorescent imaging of mpx: EGFP-positive cells in irradiated Tg(mpeg1: EGFP) transgenic zebrafish at 6 dpf. (D) Quantification of mpx:EGFP-positive cells in each group. n = 12. (E) Fluorescent imaging of mpx:EGFP-positive cells in cyclophosphamide-treated Tg(mpeg1: EGFP) zebrafish at 6 dpf. (F) Quantification of mpx:EGFP-positive cells in each group. n = 6. (G) Fluorescent imaging of lyz:DsRed-positive cells in irradiated Tg(lyz: DsRed) transgenic zebrafish at 6 dpf. (H) Quantification of lyz: DsRed-positive cells in each group. n = 12. (I) Fluorescent imaging of lyz: DsRed-positive cells in cyclophosphamide-treated Tg(lyz: DsRed) transgenic zebrafish at 6 dpf. (J) Quantification of lyz: DsRed-positive cells in each group. n = 6. Data are expressed as the mean ± SEM. **p < 0.01; ***p < 0.001; ****p < 0.0001 versus the model group. |
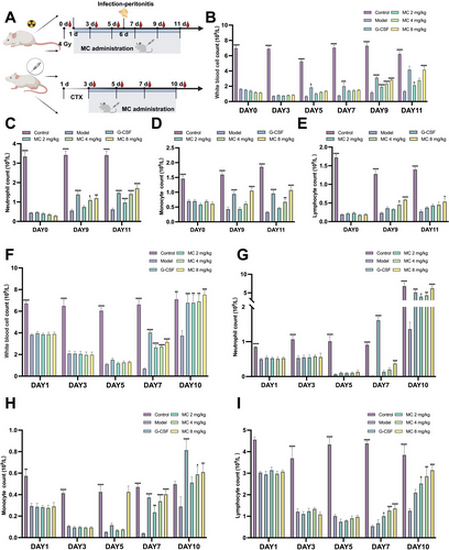
The therapeutic effect of Mulberroside C (MC) on leukopenia mice. (A) Timeline of the KM mice intervention protocol. Effect of MC (2–8 mg/kg) or granulocyte colony-stimulating factor (G-CSF, 25 μg/kg) in irradiated or cyclophosphamide-treated KM mice. In irradiated KM mice, n = 8, (B) peripheral white blood cell counts, (C) peripheral neutrophil counts, (D) peripheral monocyte counts, and (E) peripheral lymphocyte counts. In cyclophosphamide-treated KM mice, n = 6, (F) peripheral white blood cell counts, (G) peripheral neutrophil counts, (H) peripheral monocyte counts, and (I) peripheral lymphocyte counts. Data are expressed as the mean ± SEM. *p < 0.05; **p < 0.01; ***p < 0.001; ****p < 0.0001 versus the model group. |
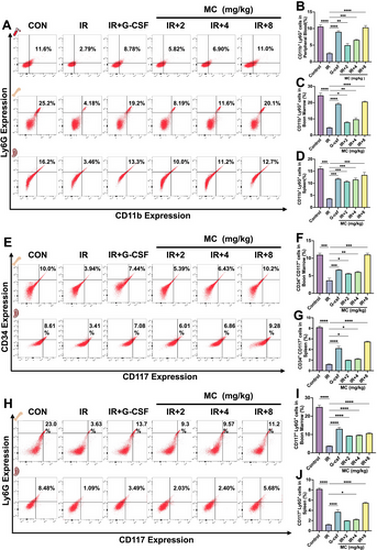
Flow cytometry analysis of myeloid cells in irradiated mice on day 9. Effect of Mulberroside C (MC, 2–8 mg/kg) or granulocyte colony-stimulating factor (G-CSF, 25 μg/kg) in irradiated KM mice. (A) Flow cytometry analysis of CD11b and Ly6G expression in peripheral blood, bone marrow, and spleen cells from each group. (B-D) Histograms show the percentage of CD11b+Ly6G+ cells in each group. n = 3. (E) Flow cytometry analysis of CD117 and CD34 expression in bone marrow and spleen cells from each group. (F-G) Histograms show the percentage of CD117+CD34+ cells in each group. n = 3. (H) Flow cytometry analysis of CD117 and Ly6G expression in bone marrow and spleen cells from each group. (I-J) Histograms showing the percentage of CD117+Ly6G+ cells in each group. n = 3. Data are expressed as the mean ± SEM. *p < 0.05; **p < 0.01; ***p < 0.001; ****p < 0.0001 versus the model group. |
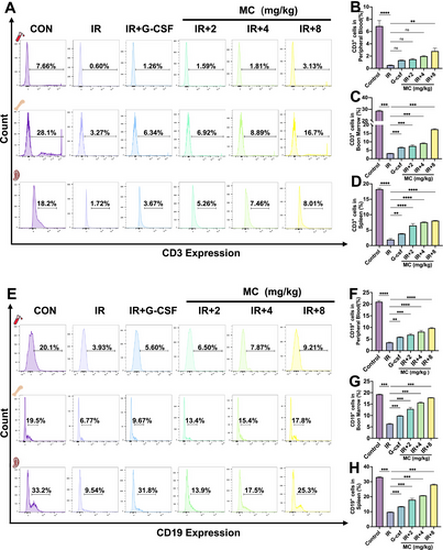
Flow cytometric profiling of lymphocytes in irradiated mice on day 9. Effect of Mulberroside C (MC, 2–8 mg/kg) or granulocyte colony-stimulating factor (G-CSF, 25 μg/kg) in irradiated Kunming (KM) mice. (A) Flow cytometry analysis of CD3 expression in peripheral blood, bone marrow, and spleen cells from each group. (B-D) Histograms display the percentage of CD3+ cells in each group. n = 3. (E) Flow cytometry analysis of CD19 expression in bone marrow and spleen cells from each group. (F-H) Histograms display the percentage of CD19+ cells in each group. n = 3. Data are expressed as the mean ± SEM. **p < 0.01; ***p < 0.001; ****p < 0.0001 versus the model group. ns = no significance. |
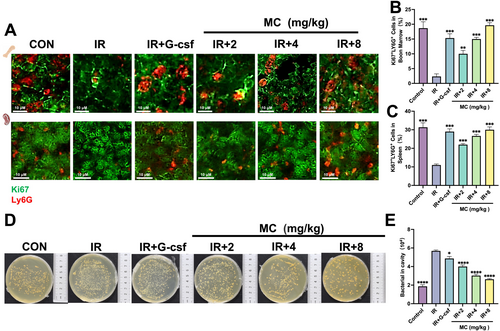
Immunofluorescence assay (day 9) and bacterial infection analysis (day 6) in irradiated mice. Effect of Mulberroside C (MC, 2–8 mg/kg) or granulocyte colony-stimulating factor (G-CSF, 25 μg/kg) in irradiated KM mice. (A) Representative immunofluorescence images showing Ki67+Ly6G+ cells in the bone marrow and spleen (Ki67: Green; Ly6G: Red) (scale bar, 10 μm). The histograms illustrate the percentage of Ki67+Ly6G+ cells (B) in bone marrow and (C) in spleen. Three technical replicates (fields of view) were analyzed from one mouse. (D) Bacterial killing assay. (E) Quantification of bacteria killed in each group. n = 3. Data are expressed as the mean ± SEM. *p < 0.05; **p < 0.01; ***p < 0.001; ****p < 0.0001 versus the model group. |
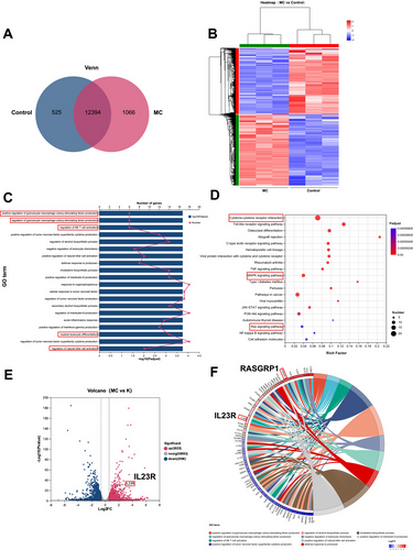
Bioinformatics analysis of gene expression profiles. NB4 cells were treated with Mulberroside C (MC, 20 μM). (A) Venn diagram showing 12,394 differentially expressed genes (DEGs) Identified by RNA-Seq. (B) Hierarchical clustering analysis of DEGs regulated by Mulberroside C (MC). (C) GO enrichment analysis of the identified DEGs. (D) Kyoto Encyclopedia of Genes and Genomes (KEGG) pathway enrichment analysis of the identified DEGs. (E) Volcano plot of DEGs regulated by MC. (F) Chord diagram of GO enrichment for the identified DEGs. |
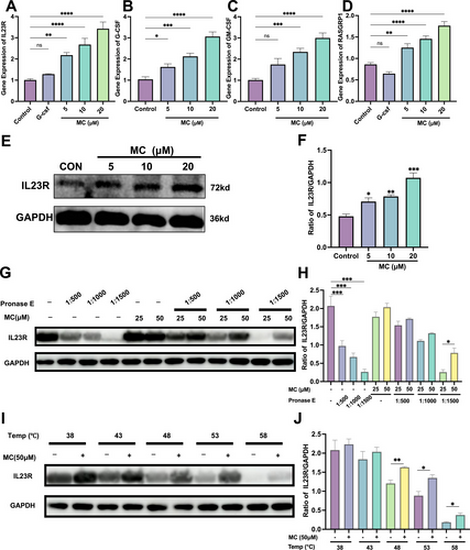
Detection of gene and protein expression in NB4 cells. qRT-PCR analysis (n = 3) of gene expression related to Mulberroside C (MC, 5–20 μM) or granulocyte colony-stimulating factor (G-CSF, 25 μg/kg), (A) IL-23R expression, (B) G-CSF expression, (C) GM-CSF expression, (D) RASGRP1 expression, and ACTB (β-actin) was used as the control gene. (E) Western blot analysis of IL-23 receptor (IL23R) protein levels treated with MC (5–20 μM) for 5 days. (F) Histograms showing the percentage of IL23R protein in each group. (G–J) Drug affinity responsive target stability (DARTS) and cellular thermal shift assay (CETSA) demonstrate the binding between MC (50 μM) and IL-23R protein. n = 3. (Student's unpaired two-tailed t-test). Data represent three independent experiments. Data are expressed as the mean ± SEM. *p < 0.05; **p < 0.01; ***p < 0.001; ****p < 0.0001 versus the control group. ns = no significance. |
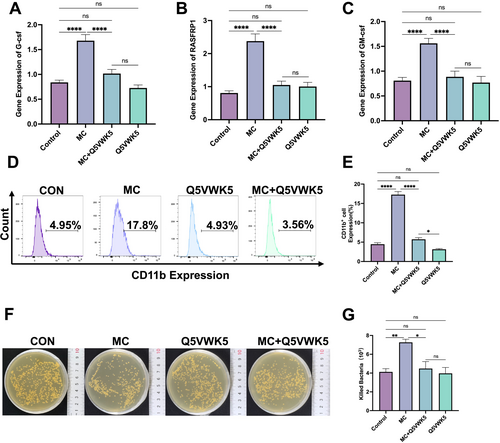
Mulberroside C (MC) stimulates leukopenia through the IL-23 receptor (IL23R). NB4 cells were treated with MC (20 μM), Q5VWK5 (IL-23R inhibitor, 6.7 μM), or a combination of MC (20 μM) + Q5VWK5 (6.7 μM) for 5 days. qRT-PCR analysis (n = 3) of, (A) G-CSF expression, (B) RASGRP1 expression, (C) GM-CSF expression, (D) Flow cytometry analysis of CD11b expression, (E) Histogram illustrating the percentage of CD11b-expressing cells across different groups. n = 3. (F) Evaluation of bactericidal activity. (G) Bacterial killing assay results are presented as histograms, showing the number of bacteria killed in each group. n = 3. Data are expressed as the mean ± SEM. *p < 0.05; **p < 0.01; ****p < 0.0001 versus corresponding control groups. ns = no significance. |
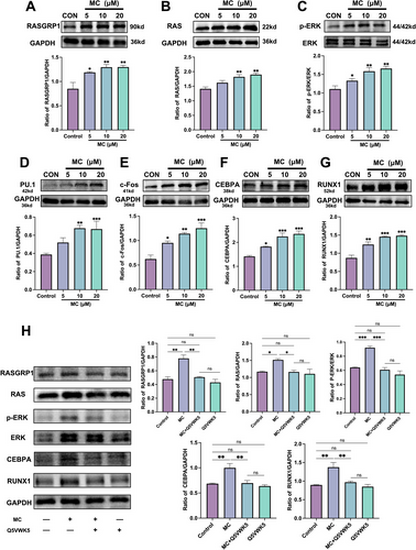
Mulberroside C (MC) promotes white blood cell (WBC) differentiation by activating the RASGRP1/RAS/ERK signaling pathway. (A–G) The expression levels of RASGRP1, RAS, ERK, PU.1, c-FOS, CEBPA, and RUNX1 were assessed by Western blotting after treatment of NB4 cells with MC (5–20 μM). n = 3. (H) Western blot analysis to evaluate the expression of RASGRP1, RAS, ERK, CEBPA, and RUNX1 in NB4 cells treated with MC (20 μM), Q5VWK5 (IL-23R inhibitor, 6.7 μM), or a combination of MC (20 μM) + Q5VWK5 (6.7 μM) for 5 days. The histogram shows the expression levels of RASGRP1, RAS, ERK, CEBPA, and RUNX1 in each treatment group. n = 3. Data are expressed as the mean ± SEM. *p < 0.05; **p < 0.01; ***p < 0.001 versus corresponding control groups. ns = no significance. |
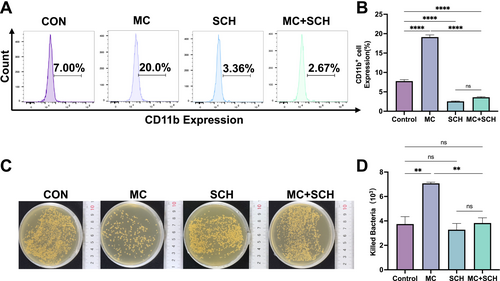
Verification of the ERK pathway. NB4 cells were treated with Mulberroside C (MC, 20 μM), ERK-specific inhibitor SCH772984 (SCH, 10 μM), or a combination of MC (20 μM) + SCH (10 μM). (A) Flow cytometry analysis of CD11b expression. (B) Histogram illustrating the percentage of CD11b-expressing cells across different groups. n = 3. (C) Evaluation of bactericidal activity. (D) Bacterial killing assay results are presented as histograms, showing the number of bacteria killed in each group. n = 3. Data are expressed as the mean ± SEM. **p < 0.01; ****p < 0.0001 versus corresponding control groups. ns = no significance. |