
FIGURE
Fig. 8
- ID
- ZDB-FIG-250827-41
- Publication
- Zhang et al., 2025 - IL-23 Receptor Agonism by Mulberroside C Activates the RASGRP1/RAS/ERK Pathway Contributing to Leukopenia Treatments
- Other Figures
- All Figure Page
- Back to All Figure Page
Fig. 8
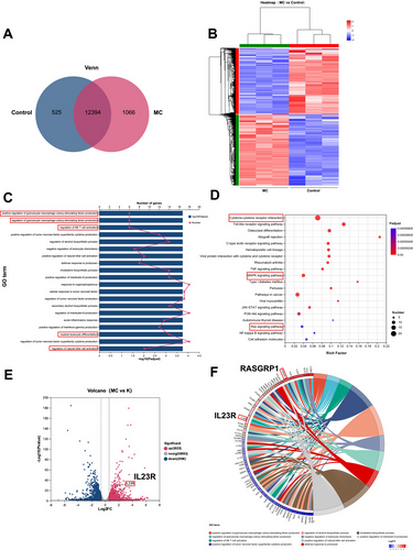
Bioinformatics analysis of gene expression profiles. NB4 cells were treated with Mulberroside C (MC, 20 μM). (A) Venn diagram showing 12,394 differentially expressed genes (DEGs) Identified by RNA-Seq. (B) Hierarchical clustering analysis of DEGs regulated by Mulberroside C (MC). (C) GO enrichment analysis of the identified DEGs. (D) Kyoto Encyclopedia of Genes and Genomes (KEGG) pathway enrichment analysis of the identified DEGs. (E) Volcano plot of DEGs regulated by MC. (F) Chord diagram of GO enrichment for the identified DEGs. |
Expression Data
Expression Detail
Antibody Labeling
Phenotype Data
Phenotype Detail
Acknowledgments
This image is the copyrighted work of the attributed author or publisher, and
ZFIN has permission only to display this image to its users.
Additional permissions should be obtained from the applicable author or publisher of the image.
Full text @ Phytother. Res.