
|
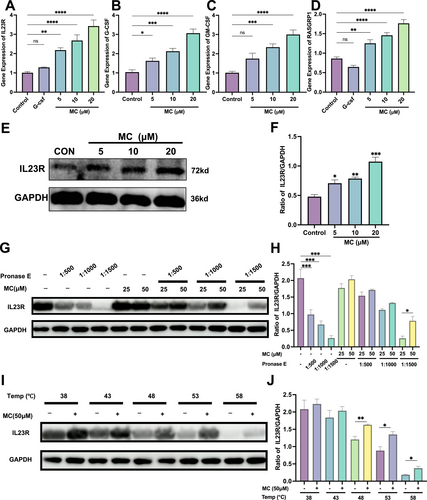
Fig. 9 Detection of gene and protein expression in NB4 cells. qRT-PCR analysis (n = 3) of gene expression related to Mulberroside C (MC, 5–20 μM) or granulocyte colony-stimulating factor (G-CSF, 25 μg/kg), (A) IL-23R expression, (B) G-CSF expression, (C) GM-CSF expression, (D) RASGRP1 expression, and ACTB (β-actin) was used as the control gene. (E) Western blot analysis of IL-23 receptor (IL23R) protein levels treated with MC (5–20 μM) for 5 days. (F) Histograms showing the percentage of IL23R protein in each group. (G–J) Drug affinity responsive target stability (DARTS) and cellular thermal shift assay (CETSA) demonstrate the binding between MC (50 μM) and IL-23R protein. n = 3. (Student's unpaired two-tailed t-test). Data represent three independent experiments. Data are expressed as the mean ± SEM. *p < 0.05; **p < 0.01; ***p < 0.001; ****p < 0.0001 versus the control group. ns = no significance.