
|
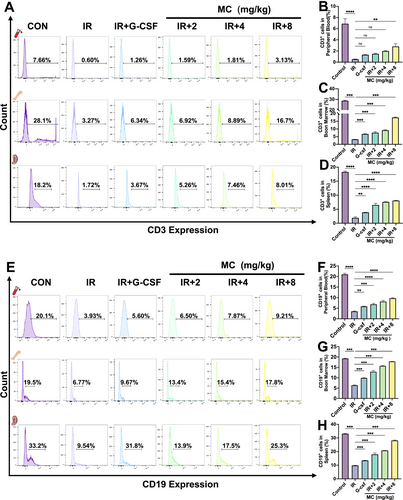
Fig. 6 Flow cytometric profiling of lymphocytes in irradiated mice on day 9. Effect of Mulberroside C (MC, 2–8 mg/kg) or granulocyte colony-stimulating factor (G-CSF, 25 μg/kg) in irradiated Kunming (KM) mice. (A) Flow cytometry analysis of CD3 expression in peripheral blood, bone marrow, and spleen cells from each group. (B-D) Histograms display the percentage of CD3+ cells in each group. n = 3. (E) Flow cytometry analysis of CD19 expression in bone marrow and spleen cells from each group. (F-H) Histograms display the percentage of CD19+ cells in each group. n = 3. Data are expressed as the mean ± SEM. **p < 0.01; ***p < 0.001; ****p < 0.0001 versus the model group. ns = no significance.