
- Title
-
Transcriptome Analysis Suggested Striking Transition Around the End of Epiboly in the Gene Regulatory Network Downstream of the Oct4-Type POU Gene in Zebrafish Embryos
- Authors
- Ikeda, M., Kobayashi, K., Nakayama-Sadakiyo, Y., Sato, Y., Tobita, A., Saito, M., Yamasu, K.
- Source
- Full text @ Dev. Growth Diff.
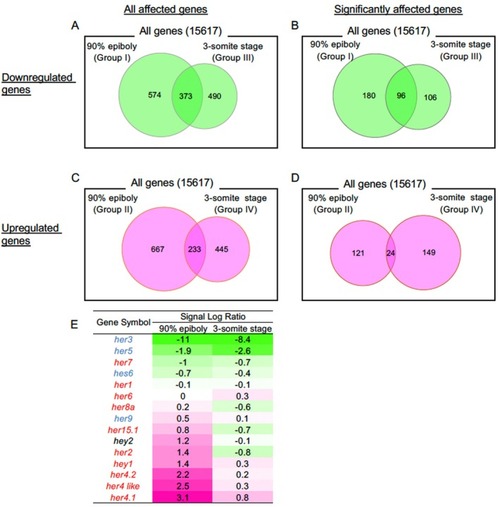
Microarray analysis of the altered transcriptome due to suppression of endogenous |
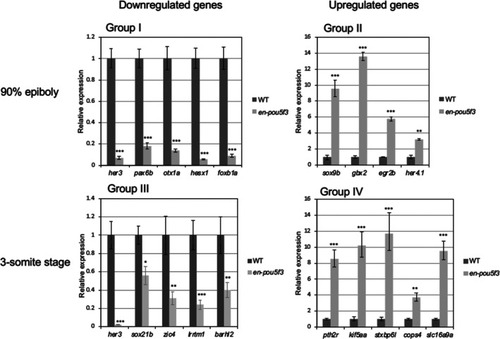
Quantitative analysis of the expression of genes that were shown to markedly change in the expression level by the microarray analyses. Expression was reevaluated by qRT‐PCR to confirm the validity of the microarray data for the genes that showed marked alteration in the expression level (Group I–IV) and/or those involved in brain formation (Group II) (Table |
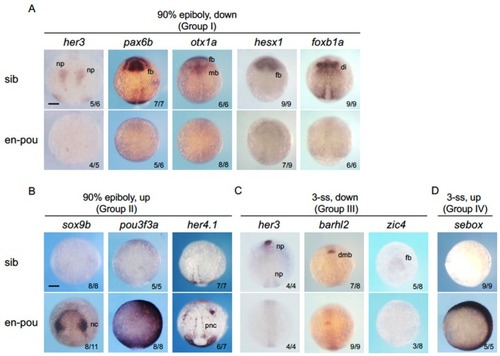
Confirmation of the altered gene expression by WISH in |
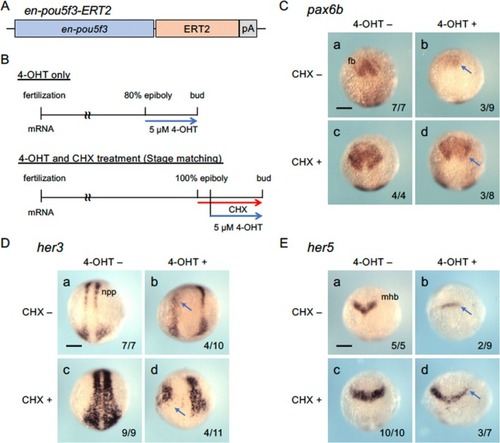
Regulation of downstream genes by activated En‐Pou5f3 in the absence of protein synthesis. A. Structure of En‐Pou5f3‐ERT2 overexpressed in embryos by mRNA injection. B. Time schedule of En‐Pou5f3‐ERT2 activation by 4‐hydroxytamoxifen (4‐OHT) and inhibition of protein synthesis by cycloheximide (CHX). Embryos injected with |
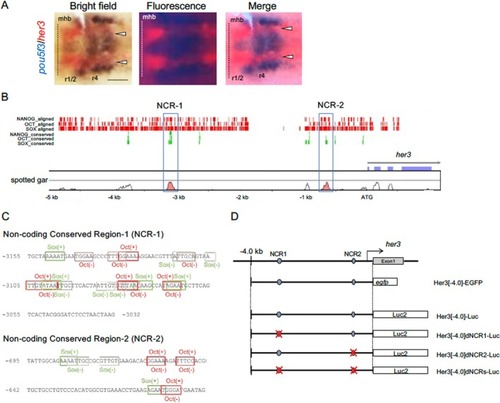
Noncoding conserved sequences found in the |
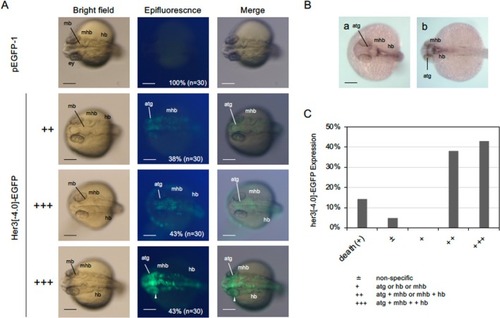
Expression of Her3[−4.0]‐EGFP in developing embryos. A. EGFP fluorescence in 24‐hpf embryos injected with pHer3[−4.0]‐EGFP DNA. Left column shows bright‐field images, the middle row shows fluorescence images, and the right column shows merged views. Dorsal views with anterior to the left. Expression rates and embryo numbers examined are shown at the bottom right. Scale bar, 200 μm. B. Endogenous expression of |

Transcriptional regulation of |
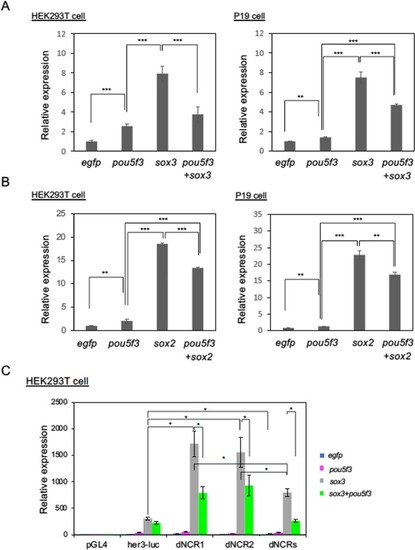
Transcriptional regulation of |