
|
FIGURE 6
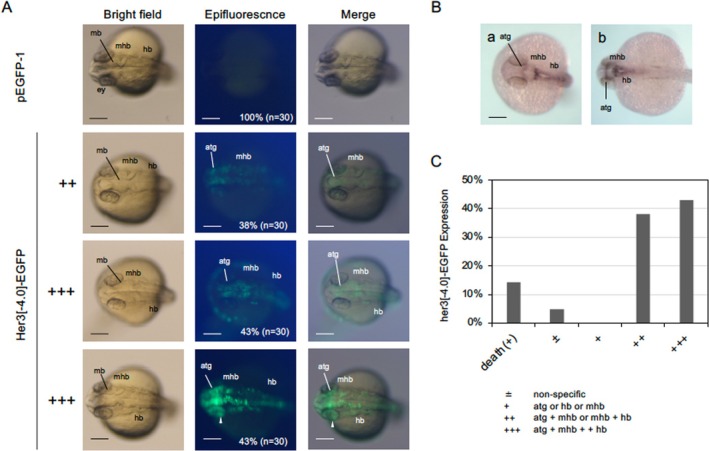
Expression of Her3[−4.0]‐EGFP in developing embryos. A. EGFP fluorescence in 24‐hpf embryos injected with pHer3[−4.0]‐EGFP DNA. Left column shows bright‐field images, the middle row shows fluorescence images, and the right column shows merged views. Dorsal views with anterior to the left. Expression rates and embryo numbers examined are shown at the bottom right. Scale bar, 200 μm. B. Endogenous expression of