FIGURE

FIGURE 1

ID
ZDB-FIG-250627-118
Publication
Ikeda et al., 2025 - Transcriptome Analysis Suggested Striking Transition Around the End of Epiboly in the Gene Regulatory Network Downstream of the Oct4-Type POU Gene in Zebrafish Embryos
Other Figures
All Figure Page
Back to All Figure Page
FIGURE 1

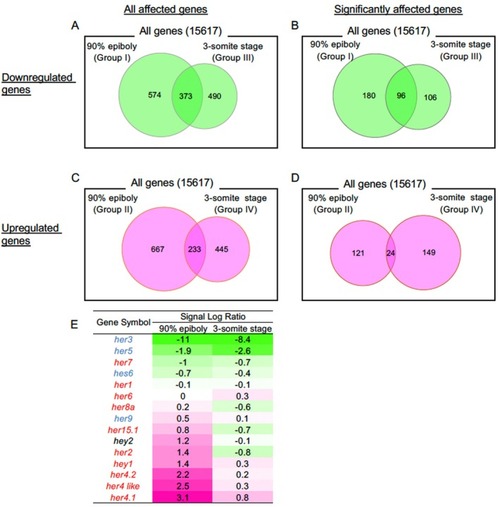
Microarray analysis of the altered transcriptome due to suppression of endogenous pou5f3 in zebrafish embryos. (A–D) Venn diagrams showing the numbers of genes/probes (total number, 15,617) whose expression was downregulated (A, B) or upregulated (C, D) by en‐pou5f3 induction at 90% epiboly (left) or 3‐ss (right), respectively. (A, C) All genes whose expression was judged to have been significantly affected by the Wilcoxon signed‐rank test (upregulated, p < 0.0025; downregulated, p > 0.9975). (B, D) Genes whose expression was evidently affected by en‐pou5f3 induction by twice or more (signal log ratio, > 1 or < −1). E. Alteration of bHLH‐O gene expression due to en‐pou5f3 induction. Signal log ratios showing changes in expression levels, obtained by the microarray, are shown with a heat map for the two induction stages. The genes are arranged based on the signal log ratios at 90% epiboly. Green indicates downregulation, and magenta indicates upregulation. Blue letters indicate her‐related genes that function in a Notch‐independent manner, whereas the genes shown in red are Notch‐dependent.

Expression Data

Expression Detail
Antibody Labeling
Phenotype Data

Phenotype Detail
Acknowledgments
This image is the copyrighted work of the attributed author or publisher, and ZFIN has permission only to display this image to its users. Additional permissions should be obtained from the applicable author or publisher of the image. Full text @ Dev. Growth Diff.