FIGURE

FIGURE 4

ID
ZDB-FIG-250627-121
Publication
Ikeda et al., 2025 - Transcriptome Analysis Suggested Striking Transition Around the End of Epiboly in the Gene Regulatory Network Downstream of the Oct4-Type POU Gene in Zebrafish Embryos
Other Figures
All Figure Page
Back to All Figure Page
FIGURE 4

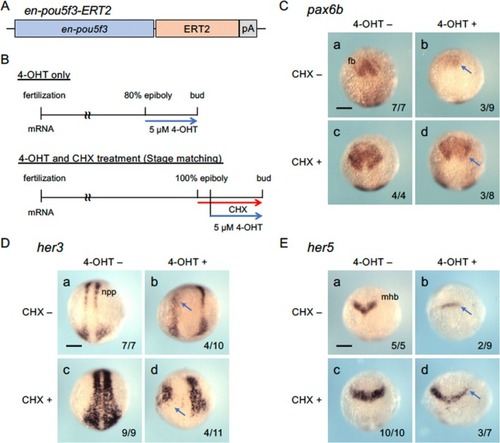
Regulation of downstream genes by activated En‐Pou5f3 in the absence of protein synthesis. A. Structure of En‐Pou5f3‐ERT2 overexpressed in embryos by mRNA injection. B. Time schedule of En‐Pou5f3‐ERT2 activation by 4‐hydroxytamoxifen (4‐OHT) and inhibition of protein synthesis by cycloheximide (CHX). Embryos injected with en‐pou5f3‐ERT2 mRNA (150 pg/embryo) were treated for 2 h from 80% epiboly (8 hpf) with 4‐OHT, fixed at the bud stage, and examined for gene expression by WISH. To inhibit protein synthesis during activation, CHX was added 30 min before (7.5 hpf) addition of 4‐OHT (age matching). However, as development almost stopped as soon as CHX was added, CHX addition was delayed (100% epiboly) in some experiments (stage matching) so that the stage (bud stage) of staining was also at the bud stage. C–E. Expression of pax6b (C), her3 (D), and her5 (E) at the bud stage in embryos where En‐Pou5f3‐ERT2 was not activated (a, c) or activated (b, d) by 4‐OHT in the absence (a, b) or presence (c, d) of CHX. Dorsal views, with anterior to the top. Downregulation is marked with blue arrows. Numbers of embryos showing downregulation and total scored embryos are shown in the bottom right. fb, forebrain; mhb, midbrain‐hindbrain boundary; npp, neural progenitor pool; fb, forebrain. Scale bar, 200 μm.

Expression Data

Expression Detail
Antibody Labeling
Phenotype Data

Phenotype Detail
Acknowledgments
This image is the copyrighted work of the attributed author or publisher, and ZFIN has permission only to display this image to its users. Additional permissions should be obtained from the applicable author or publisher of the image. Full text @ Dev. Growth Diff.