FIGURE

FIGURE 6

ID
ZDB-FIG-250627-123
Publication
Ikeda et al., 2025 - Transcriptome Analysis Suggested Striking Transition Around the End of Epiboly in the Gene Regulatory Network Downstream of the Oct4-Type POU Gene in Zebrafish Embryos
Other Figures
All Figure Page
Back to All Figure Page
FIGURE 6

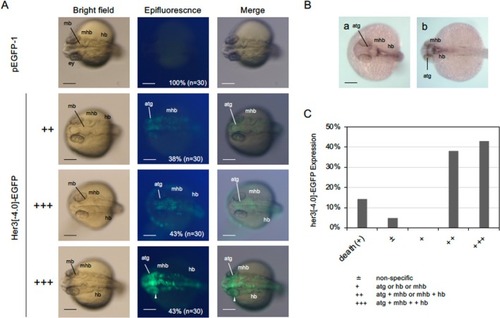
Expression of Her3[−4.0]‐EGFP in developing embryos. A. EGFP fluorescence in 24‐hpf embryos injected with pHer3[−4.0]‐EGFP DNA. Left column shows bright‐field images, the middle row shows fluorescence images, and the right column shows merged views. Dorsal views with anterior to the left. Expression rates and embryo numbers examined are shown at the bottom right. Scale bar, 200 μm. B. Endogenous expression of her3 in the brain was examined by WISH at 24 hpf. Dorsal views of the anterior brain (a) and hindbrain (b) are shown with anterior to the left. C. Histogram showing fluorescence patterns in embryos injected with the reporter gene. The ordinate shows the percentages of embryos showing the expression patterns shown along the abscissa (n = 30). +, expression in the anterior tegmentum (atg), midbrain‐hindbrain boundary (mhb), or hindbrain (hb); ++, expression in atg and mhb or mhb and hb; +++, expression in atg, mhb, and hb. ±, nonspecific expression. mb, midbrain; ey, eye (optic vesicle). Two examples of +++ embryos and one example of ++ embryos are shown, whereas no embryos were scored as +. Weak ectopic expression observed when fluorescence was intense is marked with white arrowheads.

Expression Data

Expression Detail
Antibody Labeling
Phenotype Data

Phenotype Detail
Acknowledgments
This image is the copyrighted work of the attributed author or publisher, and ZFIN has permission only to display this image to its users. Additional permissions should be obtained from the applicable author or publisher of the image. Full text @ Dev. Growth Diff.