IMAGE

FIGURE 7

ID
ZDB-IMAGE-250627-125
Source
Figures for Ikeda et al., 2025
Image
Figure Caption

FIGURE 7

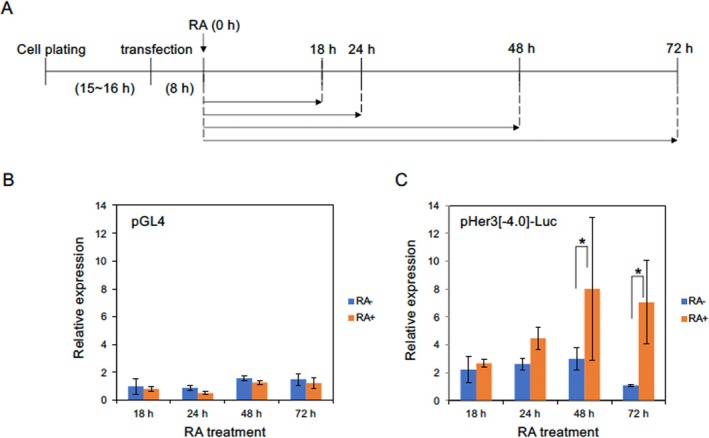
Transcriptional regulation of her3 in P19 cells undergoing neural differentiation. A. Time schedule for inducing neuronal differentiation by exposure to retinoic acid (RA). Horizontal arrows indicate the durations after RA addition at 0 h. B, C. Expression of the backbone luciferase plasmid (pGL4, left) and pHer3[−4.0]‐Luc (right) after exposure of P19 cells to RA for the duration shown on the abscissa. The expression levels of firefly luciferase were standardized by Renilla luciferase expression as an internal control. Blue and orange bars indicate the reporter expression in the absence or presence of RA, respectively, relative to the expression of pGL4 at 18 h in the absence of RA. The experiments were repeated three times, resulting in essentially the same results. Error bars, standard deviations of means. *, p < 0.05.

Acknowledgments
This image is the copyrighted work of the attributed author or publisher, and ZFIN has permission only to display this image to its users. Additional permissions should be obtained from the applicable author or publisher of the image. Full text @ Dev. Growth Diff.