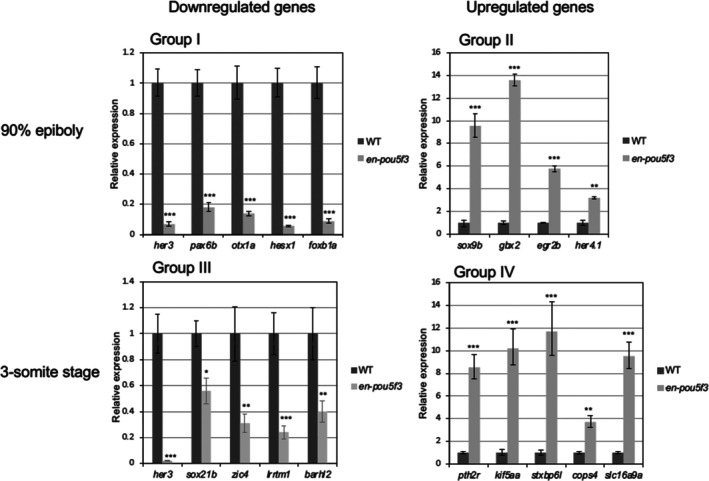
IMAGE

FIGURE 2

ID
ZDB-IMAGE-250627-119
Source
Figures for Ikeda et al., 2025
Image
Figure Caption

FIGURE 2

Quantitative analysis of the expression of genes that were shown to markedly change in the expression level by the microarray analyses. Expression was reevaluated by qRT‐PCR to confirm the validity of the microarray data for the genes that showed marked alteration in the expression level (Group I–IV) and/or those involved in brain formation (Group II) (Table 1). Regarding several Group II genes and sebox that had shown strikingly altered expression in the microarray, we failed to reliably quantitate the expression for unknown reasons and not shown here. The experiments were repeated three times, resulting in essentially the same results. The ordinates represent the expression levels in the en‐pou5f3‐induced embryos (light gray bars) relative to those in wild‐type sibling embryos (dark gray bars) for respective genes. Error bars, standard errors of means. *, p < 0.05; **, p < 0.01; ***, p < 0.001.

Acknowledgments
This image is the copyrighted work of the attributed author or publisher, and ZFIN has permission only to display this image to its users. Additional permissions should be obtained from the applicable author or publisher of the image. Full text @ Dev. Growth Diff.