IMAGE

FIGURE 3

ID
ZDB-IMAGE-250627-120
Source
Figures for Ikeda et al., 2025
Image
Figure Caption

FIGURE 3

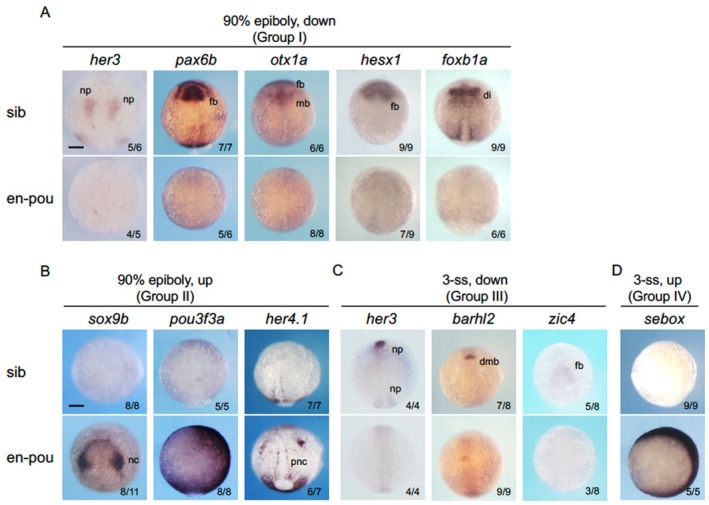
Confirmation of the altered gene expression by WISH in en‐pou5f3‐induced embryos. The expression patterns of the genes that had been shown to markedly differ in expression levels by the microarray analysis (Table 1) were examined by WISH (A, Group I; B, Group II; C, Group III; D, Group IV). Embryos from crosses between en‐pou5f3+/− fish and wild‐type fish were subjected to en‐pou5f3 induction at 90% epiboly (A, B) or 3‐ss (C, D), and after further development at 25°C for 1 h, the expression patterns of genes of interest were stained. After observations, respective embryos were genotyped. Dorsal views with anterior to the top. For each gene, the expression in wild‐type sibling (sib) and en‐pou5f3+/− (en‐pou) embryos are shown on the top and bottom, respectively. The numbers of embryos showing the indicated expression patterns and total scored embryos are shown in the bottom right. di, diencephalon; dmb, diencephalon‐midbrain boundary; fb, forebrain; mb, midbrain; nc, neural crest; np, neural plate; pnc, proneural cluster. Scale bar, 200 μm.

Acknowledgments
This image is the copyrighted work of the attributed author or publisher, and ZFIN has permission only to display this image to its users. Additional permissions should be obtained from the applicable author or publisher of the image. Full text @ Dev. Growth Diff.