FIGURE SUMMARY
Title

Melanoma innervation, noradrenaline and cancer progression in zebrafish xenograft model

Authors
Lorenzini, F., Marines, J., Le Friec, J., Do Khoa, N., Nieto, M.A., Sanchez-Laorden, B., Mione, M.C., Fontenille, L., Kissa, K.
Source
Full text @ Cell Death Discov

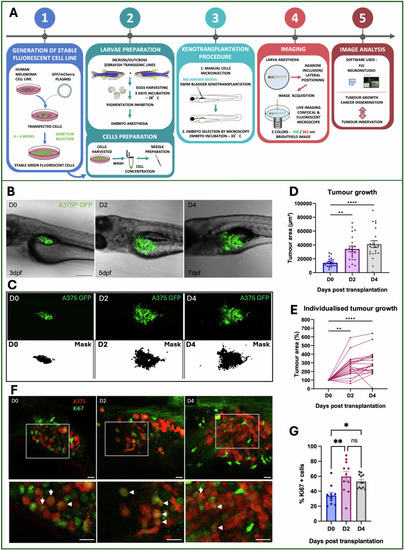
Evaluation of in vivo melanoma growth.

A Experimental workflow of zebrafish xenograft assay. (1) Generation of melanoma fluorescent human cancer cell lines (A375); (2) Cells and larvae preparation prior to transplantation; (3) Xenotransplantation procedure; (4) Imaging and Image analysis (5). B Transplanted larvae with A375P GFP+ (green) are shown in the images, acquired with a confocal microscope from D0 to D4. Images derive from Z-projection (z-stack = 170-200 μm). Scale bar = 250 μm. C Representative xenografted melanoma tumors (green or black) are shown to explain how the analysis of tumor growth was made. Tumor growth was measured on the maximum projection of z-stack acquisitions. To determine tumor area, a threshold was applied in Fiji for each larva on D0, D2,and D4 to generate a mask. First line: maximum projection of the images on D0, D2, and D4 (z-stack = 170–00 μm). Second line: masks of the corresponding tumors, generated using Fiji software. D, E Tumor growth analysis. D Individualized tumor areas were normalized to D0 to monitor the percentage of the tumor growth in every single larva. E. The tumor area of individualized larvae was daily monitored from D0 to D4. The tumor area is expressed in μm2. F Representative xenografted melanoma tumors stained for Ki67 marker are shown to visualize proliferate A375 proliferative cells. In red A375 melanoma cells, in green Ki67+ cells. Images are single slices acquired for different xenografted larvae on D0, D2, and D4. Scale bar: 20 µm. G Percentage of Ki67 + A375 cells in transplanted larvae on D0, D2, and D4. Results in (D, E, G) are expressed as mean ± SEM, n = 10–21. Friedman test and ordinary one-way ANOVA were used to evaluate the significance: *P-value < 0.05, **P-value < 0.01, ***P-value < 0.001, ****P-value < 0.0001.

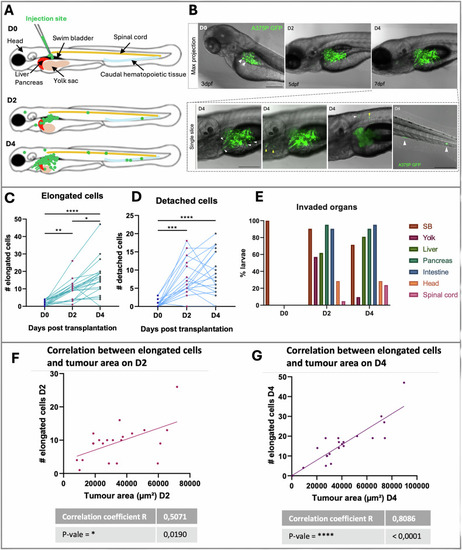
In vivo invasiveness and dissemination of A375P cells after xenografting in larval zebrafish.

A Schematic representation of A375P cells transplanted in the swim bladder of a zebrafish larva at 3 dpf and monitoring of the tumor fate at D2 and D4. B Representative images of transplanted larvae with invading and migrating A375 GFP+ cells (green) on D0, D2, and D4. First line: z-projection images (z-stack = 170–200 μm). Second line: four different single slices of the same embryo acquired in the swim bladder and the caudal hematopoietic tissue (last panel) at D4. Scale bar = 250 μm. White arrowheads point elongated and disseminated cells. C The graph shows the quantification of elongated cells. The invasive cells were daily counted in every larva on D0, D2, and D4. D. The graph shows the quantification of detached cells from the primary cancer mass. The detached cells were daily counted in every larva on D0, D2, and D4. Friedman test was used to evaluate the significance in (C) and (D): *P-value < 0.05, **P-value < 0.01, ***P-value < 0.001, ****P-value < 0.0001. n = 21. E A375P cells invade the surrounding organs of the SB in larval zebrafish. The graph shows the percentage (normalized to the total number of larvae) of larvae with melanoma cells in the surrounding organs/regions near the SB on D0, D2, and D4. F, G The graphs represent the correlation between the number of elongated cells and the tumor area (μm2) on D2 (E) and on D4 (F). Scale bar = 250 μm. Non-parametric Spearman correlation was performed to test the possible correlation: *P-value < 0.0332, **P-value < 0.0021, ***P-value < 0.0002, ****P-value < 0.0001. n = 21.

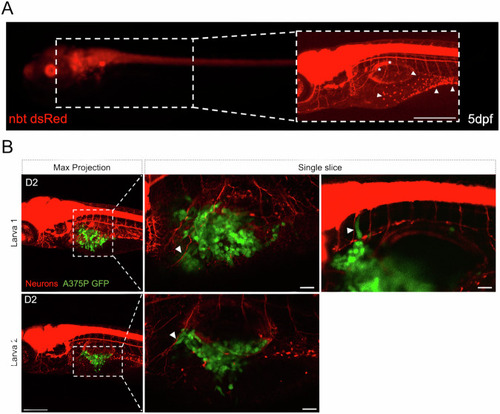
Interactions between PNS and transplanted melanoma cells in larval zebrafish.

A Representative images of a 5 dpf tg(nbt:dsRed) larva, acquired with a fluorescent microscope. Zoomed area: picture of the same larvae acquired with a confocal microscope. Scale bar = 250 μm. White arrowheads = enteric neural cell bodies. White asterisks = axons. B Representative images of xenografted larvae with A375P cells on D2, acquired with a confocal microscope. Transplanted A375P cells are in green, neurons are in red. A375 cells seem to escape from the primary cancer mass by following the axons as a route of dissemination (white arrowheads). First column: z-projection images (z-stack = 170–200 μm) of larva 1 and larva 2. Scale bar = 250 μm. Second and third columns: zoomed images of the region around the SB of larva 1 and larva 2 corresponding to different single slices. Scale bar = 50 μm.

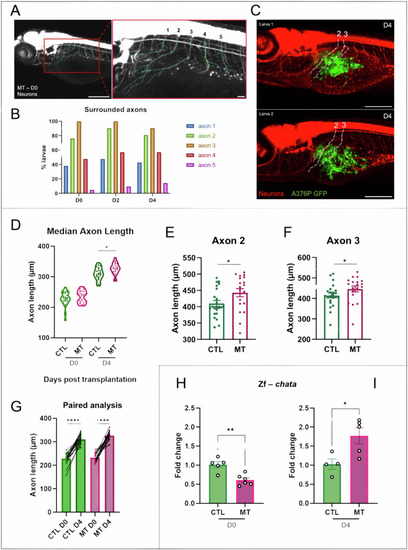
Axonogenesis in zebrafish xenograft melanoma model.

A Representative images of a 3 dpf larva from NeuronStudio software. Five axons around the region of the SB were selected and manually traced in 3D using NeuronStudio to measure the axon length and to count the dendritic branching points. Scale bar = 250 μm/Scale bar = 50 μm. B The graph shows the percentage of larvae with axons 1–5 surrounding A375P cells. C Representative images of 7 dpf (D4) larvae with marked axon numbers 2 and 3. The images are taken using a confocal microscope. Scale bar = 250 μm. DG Axonogenesis was observed in the xenograft melanoma model. D The graph shows the average length of the five axons in every single larva in every condition on D0 and D4. n = 19–26. The measure of the axon length was performed using the NeuronStudio software. After manually tracing the axons and the dendritic branches, the software gave a summary with the length of every axon. E, F The graphs show the axon length on D4 of the axon number 2 (E) and axon number 3 (F), the most affected axons by the presence of A375P cells. Differences among groups were analyzed by two-tailed unpaired Student’s t test in (DF): *P-value < 0.05. n = 19–23. G The graph represents the paired analyses of the average of the five axons length of CTL and MT conditions on D0 and D4 as indicated. Differences among groups were analyzed by two-tailed paired Student’s t test in (G): *P-value < 0.05, **P-value < 0.01, ***P-value < 0.001, ****P-value < 0.0001. n = 19–22. The values in (DG) are expressed in μm. H, I Quantitative PCR analysis of the expression of the presynaptic cholinergic gene, choline acetyltransferase (chata), in the CTL and MT samples on D0 and D4 as indicated. Two-tailed unpaired Student’s t test was performed to evaluate the significance: *P-value < 0.05, **P-value < 0.01. n = 4–6. Results in (E, F) and (H, I) are expressed as means ± SEM. CTL = larvae injected with PBS. MT (melanoma transplant) = larvae transplanted with A375P GFP+ cells.

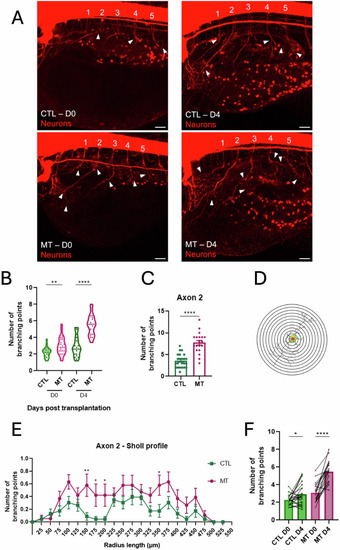
Dendritogenesis in zebrafish xenograft melanoma model.

A Representative images of nbt CTL and MT larvae on D0 and D4. Neurons are in red. White arrowheads point the branching points. Images are taken using a confocal microscope. Scale bar = 25 μm. B The graph represents the average of the branching points’ number of the five axons in every larva in CTL and MT conditions on D0 and D4. n = 19–26. C The graph represents the number of branching points of the axon number 2 in every larva in CTL and MT conditions on D4. n = 19–23. Results are expressed as means ± SEM. Differences among groups were analyzed by two-tailed unpaired Student’s t test in (A, B): *P-value < 0.05, **P-value < 0.01, ***P-value < 0.001, ****P-value < 0.0001. D Schematic view that allows the description of the Sholl analysis, a quantitative method to study the dendritic anatomy. The picture shows concentric rings centered on the soma center of the neurons. From the center, the Sholl analysis starts counting the number of intersections of the dendrites with the different rings, reporting the distance from the soma center. The number of intersections is the number of dendritic branches. The data acquired from the analysis allow the construction of the Sholl profile. E The Sholl profile of axon number 2 on D4. The sholl profile is a graph that plots the number of the branching points against the radial distance from the soma center. The radial step between every ring is 25 μm. The axons analyzed in this work are from neurons, whose somas are placed in the spinal cord. Thus, the soma center was generally placed in the ventral part of the spinal cord for every neuron/axon. Differences among groups were analyzed by Mann–Whitney test: *P-value < 0.05, **P-value < 0.01. n = 22. Results in (B) and (D) are expressed as means ± SEM. F The graph represents the paired analyses of average of the five axons’ branching points of CTL and MT conditions on D0 and D4 as indicated. Differences among groups were analyzed by two-tailed paired Student’s t test in (D, F): *P-value < 0.05, **P-value < 0.01, ***P-value < 0.001, ****P-value < 0.0001. CTL = larvae injected with PBS. MT (melanoma transplant) = larvae transplanted with A375P GFP + cells.

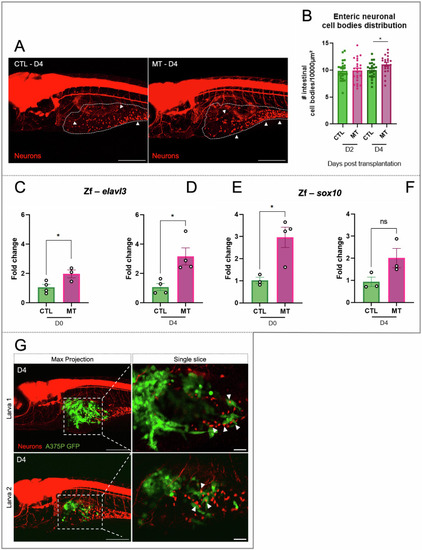
Neurogenesis in zebrafish xenograft melanoma model.
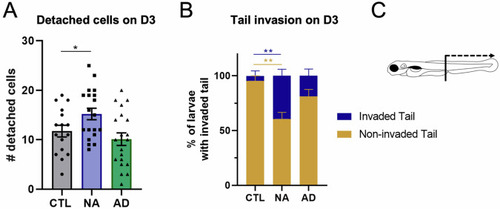
A Representative images of nbt CTL and MT larvae on D4. Neurons are in red. Surrounded areas delimit the intestinal zone, white arrowheads point the enteric neural cell bodies. Images are taken using a confocal microscope. Scale bar = 250 μm. B The graph shows the number of enteric neural cell bodies per 104 μm in CTL and MT conditions on D2 and D3. Differences among groups were analyzed by two-tailed unpaired Student’s t test: *P-value < 0.05. n = 21–24. CF Quantitative PCR analysis of the expression of the early neurogenesis marker elavl3 (C, D) and the NC marker sox10 (E, F) in CTL and MT samples on D0 and D4 as indicated. Two-tailed unpaired Student’s t test was performed to evaluate significance: *P-value < 0.05. n = 3–4. Results in (B-F) are expressed as means ± SEM. G Representative images of xenografted larvae with A375P cells on D4. Images were acquired with a confocal microscope. Transplanted A375P cells are in green, neurons are in red. First column: z-projection images (z-stack = 170–200 μm) of larva 1 and larva 2. Scale bar = 250 μm. Second column: single slice of the zoomed area of the corresponding projection images. White arrowheads point the contact between enteric neural cell bodies and cancer cells. Scale bar = 50 μm. CTL = larvae injected with PBS. MT (melanoma transplant) = larvae transplanted with A375P GFP + cells.

Effect of catecholamines in xenograft melanoma model.

A The graph shows the quantification of detached cells from the primary cancer mass on D3. Detached cells were counted daily in larvae for every condition on D0 and D3. Larval xenografts with already disseminated cells on D0 were excluded from the analysis, to avoid considering larvae with accidentally transplanted cells in the blood circulation. Differences among treated conditions and control conditions were analyzed by ordinary one-way ANOVA: *P-value < 0.05. n = 16–20. B Graph represents the percentage of larvae with tail invaded/non-invaded by A375P cells in the three indicated conditions. Differences among treated conditions and control conditions were analyzed by two-way ANOVA: *P-value < 0.0332, **P-value < 0.0021. n = 19–20. C Schematic representation of larva where the region of the tail is indicated. Cancer cells in the tail = detached cells localized from urogenital opening until the posterior part of the CHT. NA 10 μM = larvae transplanted with A375P cells and co-injected with 10 μM of noradrenaline. AD 1 μM = larvae transplanted with A375P cells and co-injected with 1 μM of adrenaline.

Acknowledgments
This image is the copyrighted work of the attributed author or publisher, and ZFIN has permission only to display this image to its users. Additional permissions should be obtained from the applicable author or publisher of the image. Full text @ Cell Death Discov