FIGURE

Fig. 7

ID
ZDB-FIG-250602-115
Publication
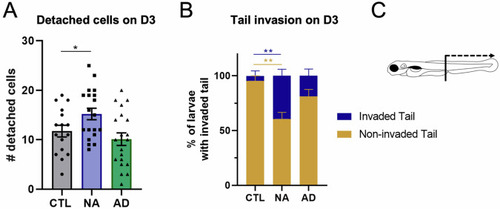
Lorenzini et al., 2025 - Melanoma innervation, noradrenaline and cancer progression in zebrafish xenograft model
Other Figures
All Figure Page
Back to All Figure Page
Fig. 7

Effect of catecholamines in xenograft melanoma model.

A The graph shows the quantification of detached cells from the primary cancer mass on D3. Detached cells were counted daily in larvae for every condition on D0 and D3. Larval xenografts with already disseminated cells on D0 were excluded from the analysis, to avoid considering larvae with accidentally transplanted cells in the blood circulation. Differences among treated conditions and control conditions were analyzed by ordinary one-way ANOVA: *P-value < 0.05. n = 16–20. B Graph represents the percentage of larvae with tail invaded/non-invaded by A375P cells in the three indicated conditions. Differences among treated conditions and control conditions were analyzed by two-way ANOVA: *P-value < 0.0332, **P-value < 0.0021. n = 19–20. C Schematic representation of larva where the region of the tail is indicated. Cancer cells in the tail = detached cells localized from urogenital opening until the posterior part of the CHT. NA 10 μM = larvae transplanted with A375P cells and co-injected with 10 μM of noradrenaline. AD 1 μM = larvae transplanted with A375P cells and co-injected with 1 μM of adrenaline.

Expression Data

Expression Detail
Antibody Labeling
Phenotype Data

Phenotype Detail
Acknowledgments
This image is the copyrighted work of the attributed author or publisher, and ZFIN has permission only to display this image to its users. Additional permissions should be obtained from the applicable author or publisher of the image. Full text @ Cell Death Discov