IMAGE

Fig. 6

ID
ZDB-IMAGE-250602-111
Source
Figures for Lorenzini et al., 2025
Image
Figure Caption

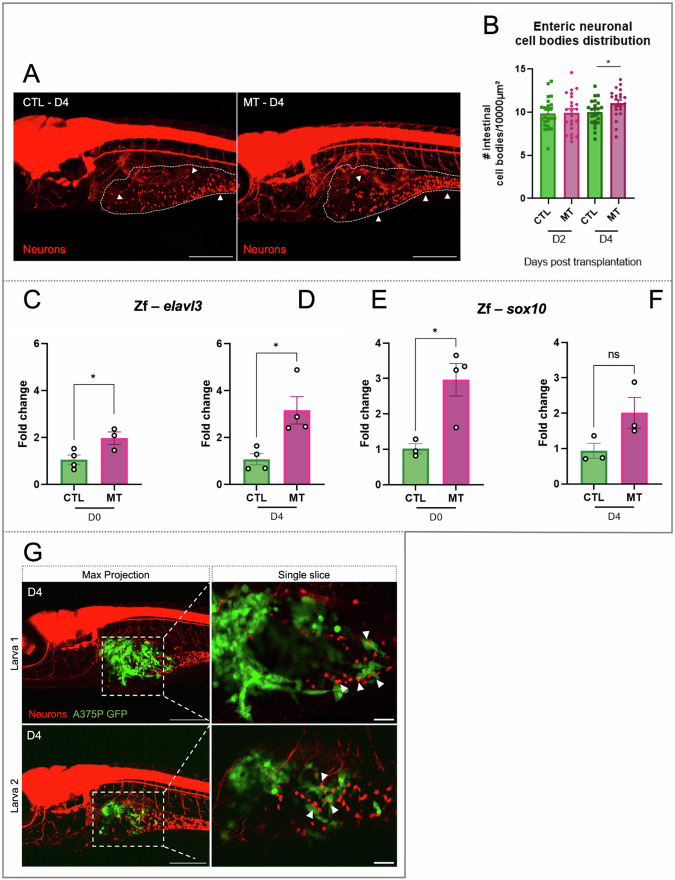
Fig. 6 Neurogenesis in zebrafish xenograft melanoma model.

A Representative images of nbt CTL and MT larvae on D4. Neurons are in red. Surrounded areas delimit the intestinal zone, white arrowheads point the enteric neural cell bodies. Images are taken using a confocal microscope. Scale bar = 250 μm. B The graph shows the number of enteric neural cell bodies per 104 μm in CTL and MT conditions on D2 and D3. Differences among groups were analyzed by two-tailed unpaired Student’s t test: *P-value < 0.05. n = 21–24. CF Quantitative PCR analysis of the expression of the early neurogenesis marker elavl3 (C, D) and the NC marker sox10 (E, F) in CTL and MT samples on D0 and D4 as indicated. Two-tailed unpaired Student’s t test was performed to evaluate significance: *P-value < 0.05. n = 3–4. Results in (B-F) are expressed as means ± SEM. G Representative images of xenografted larvae with A375P cells on D4. Images were acquired with a confocal microscope. Transplanted A375P cells are in green, neurons are in red. First column: z-projection images (z-stack = 170–200 μm) of larva 1 and larva 2. Scale bar = 250 μm. Second column: single slice of the zoomed area of the corresponding projection images. White arrowheads point the contact between enteric neural cell bodies and cancer cells. Scale bar = 50 μm. CTL = larvae injected with PBS. MT (melanoma transplant) = larvae transplanted with A375P GFP + cells.

Acknowledgments
This image is the copyrighted work of the attributed author or publisher, and ZFIN has permission only to display this image to its users. Additional permissions should be obtained from the applicable author or publisher of the image. Full text @ Cell Death Discov