|
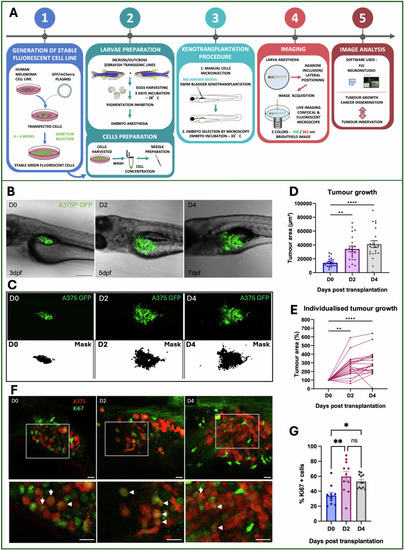
Evaluation of in vivo melanoma growth. A Experimental workflow of zebrafish xenograft assay. (1) Generation of melanoma fluorescent human cancer cell lines (A375); (2) Cells and larvae preparation prior to transplantation; (3) Xenotransplantation procedure; (4) Imaging and Image analysis (5). B Transplanted larvae with A375P GFP+ (green) are shown in the images, acquired with a confocal microscope from D0 to D4. Images derive from Z-projection (z-stack = 170-200 μm). Scale bar = 250 μm. C Representative xenografted melanoma tumors (green or black) are shown to explain how the analysis of tumor growth was made. Tumor growth was measured on the maximum projection of z-stack acquisitions. To determine tumor area, a threshold was applied in Fiji for each larva on D0, D2,and D4 to generate a mask. First line: maximum projection of the images on D0, D2, and D4 (z-stack = 170–00 μm). Second line: masks of the corresponding tumors, generated using Fiji software. D, E Tumor growth analysis. D Individualized tumor areas were normalized to D0 to monitor the percentage of the tumor growth in every single larva. E. The tumor area of individualized larvae was daily monitored from D0 to D4. The tumor area is expressed in μm2. F Representative xenografted melanoma tumors stained for Ki67 marker are shown to visualize proliferate A375 proliferative cells. In red A375 melanoma cells, in green Ki67+ cells. Images are single slices acquired for different xenografted larvae on D0, D2, and D4. Scale bar: 20 µm. G Percentage of Ki67 + A375 cells in transplanted larvae on D0, D2, and D4. Results in (D, E, G) are expressed as mean ± SEM, n = 10–21. Friedman test and ordinary one-way ANOVA were used to evaluate the significance: *P-value < 0.05, **P-value < 0.01, ***P-value < 0.001, ****P-value < 0.0001.
|