|
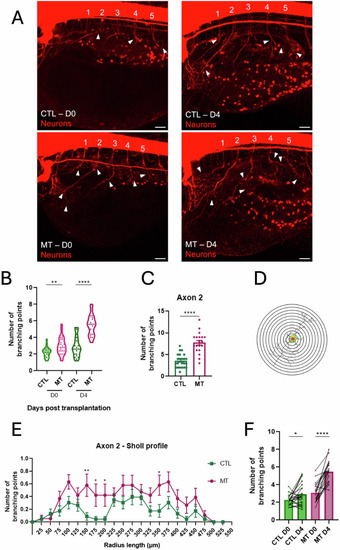
Dendritogenesis in zebrafish xenograft melanoma model. A Representative images of nbt CTL and MT larvae on D0 and D4. Neurons are in red. White arrowheads point the branching points. Images are taken using a confocal microscope. Scale bar = 25 μm. B The graph represents the average of the branching points’ number of the five axons in every larva in CTL and MT conditions on D0 and D4. n = 19–26. C The graph represents the number of branching points of the axon number 2 in every larva in CTL and MT conditions on D4. n = 19–23. Results are expressed as means ± SEM. Differences among groups were analyzed by two-tailed unpaired Student’s t test in (A, B): *P-value < 0.05, **P-value < 0.01, ***P-value < 0.001, ****P-value < 0.0001. D Schematic view that allows the description of the Sholl analysis, a quantitative method to study the dendritic anatomy. The picture shows concentric rings centered on the soma center of the neurons. From the center, the Sholl analysis starts counting the number of intersections of the dendrites with the different rings, reporting the distance from the soma center. The number of intersections is the number of dendritic branches. The data acquired from the analysis allow the construction of the Sholl profile. E The Sholl profile of axon number 2 on D4. The sholl profile is a graph that plots the number of the branching points against the radial distance from the soma center. The radial step between every ring is 25 μm. The axons analyzed in this work are from neurons, whose somas are placed in the spinal cord. Thus, the soma center was generally placed in the ventral part of the spinal cord for every neuron/axon. Differences among groups were analyzed by Mann–Whitney test: *P-value < 0.05, **P-value < 0.01. n = 22. Results in (B) and (D) are expressed as means ± SEM. F The graph represents the paired analyses of average of the five axons’ branching points of CTL and MT conditions on D0 and D4 as indicated. Differences among groups were analyzed by two-tailed paired Student’s t test in (D, F): *P-value < 0.05, **P-value < 0.01, ***P-value < 0.001, ****P-value < 0.0001. CTL = larvae injected with PBS. MT (melanoma transplant) = larvae transplanted with A375P GFP + cells.
|