IMAGE

Fig. 2

ID
ZDB-IMAGE-250602-115
Source
Figures for Lorenzini et al., 2025
Image
Figure Caption

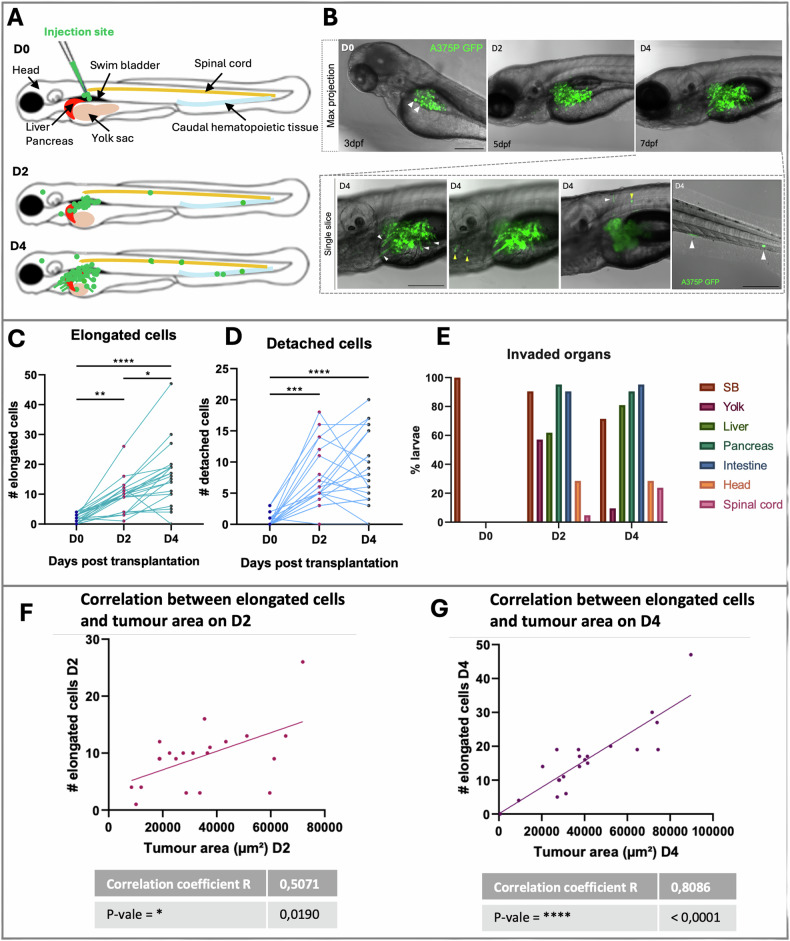
Fig. 2 In vivo invasiveness and dissemination of A375P cells after xenografting in larval zebrafish.

A Schematic representation of A375P cells transplanted in the swim bladder of a zebrafish larva at 3 dpf and monitoring of the tumor fate at D2 and D4. B Representative images of transplanted larvae with invading and migrating A375 GFP+ cells (green) on D0, D2, and D4. First line: z-projection images (z-stack = 170–200 μm). Second line: four different single slices of the same embryo acquired in the swim bladder and the caudal hematopoietic tissue (last panel) at D4. Scale bar = 250 μm. White arrowheads point elongated and disseminated cells. C The graph shows the quantification of elongated cells. The invasive cells were daily counted in every larva on D0, D2, and D4. D. The graph shows the quantification of detached cells from the primary cancer mass. The detached cells were daily counted in every larva on D0, D2, and D4. Friedman test was used to evaluate the significance in (C) and (D): *P-value < 0.05, **P-value < 0.01, ***P-value < 0.001, ****P-value < 0.0001. n = 21. E A375P cells invade the surrounding organs of the SB in larval zebrafish. The graph shows the percentage (normalized to the total number of larvae) of larvae with melanoma cells in the surrounding organs/regions near the SB on D0, D2, and D4. F, G The graphs represent the correlation between the number of elongated cells and the tumor area (μm2) on D2 (E) and on D4 (F). Scale bar = 250 μm. Non-parametric Spearman correlation was performed to test the possible correlation: *P-value < 0.0332, **P-value < 0.0021, ***P-value < 0.0002, ****P-value < 0.0001. n = 21.

Acknowledgments
This image is the copyrighted work of the attributed author or publisher, and ZFIN has permission only to display this image to its users. Additional permissions should be obtained from the applicable author or publisher of the image. Full text @ Cell Death Discov