IMAGE

Fig. 3

ID
ZDB-IMAGE-250602-116
Source
Figures for Lorenzini et al., 2025
Image
Figure Caption

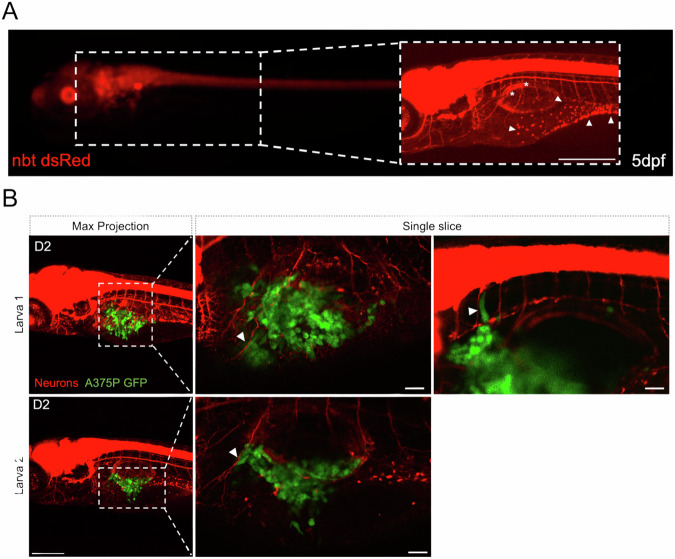
Fig. 3 Interactions between PNS and transplanted melanoma cells in larval zebrafish.

A Representative images of a 5 dpf tg(nbt:dsRed) larva, acquired with a fluorescent microscope. Zoomed area: picture of the same larvae acquired with a confocal microscope. Scale bar = 250 μm. White arrowheads = enteric neural cell bodies. White asterisks = axons. B Representative images of xenografted larvae with A375P cells on D2, acquired with a confocal microscope. Transplanted A375P cells are in green, neurons are in red. A375 cells seem to escape from the primary cancer mass by following the axons as a route of dissemination (white arrowheads). First column: z-projection images (z-stack = 170–200 μm) of larva 1 and larva 2. Scale bar = 250 μm. Second and third columns: zoomed images of the region around the SB of larva 1 and larva 2 corresponding to different single slices. Scale bar = 50 μm.

Acknowledgments
This image is the copyrighted work of the attributed author or publisher, and ZFIN has permission only to display this image to its users. Additional permissions should be obtained from the applicable author or publisher of the image. Full text @ Cell Death Discov