FIGURE SUMMARY
Title

Dendritic atoh1a+ cells serve as Merkel cell precursors during skin development and regeneration

Authors
Craig, E.W., Black, E.C., Fernandes, S.Z., Ferdous, A.S., Goo, C.E.A., Sargent, S.M., Quitevis, E.J.A., Swearer, A.A., Yee, N.G., Shin, J., Solnica-Krezel, L., Rasmussen, J.P.
Source
Full text @ Development

Identification of a transient and morphologically distinct population of keratinocyte-derived atoh1a+ cells during skin development. (A) Schematic of live-imaging methodology for visualizing MCs (green) along the lateral zebrafish trunk. (B) Illustration of adult trunk skin in cross-section. Stratified layers of keratinocytes with interspersed MCs (green) reside above the bony scale (pink). (C) Tg(atoh1a:lifeact-egfp) allows visualization of the MC F-actin cytoskeleton, including microvilli. (D-H) Representative images of atoh1a+ MCs [green; Tg(atoh1a:lifeact-egfp)] and scales (magenta; Alizarin Red S staining) along the lateral trunk at the indicated stages. Regions outlined in D-H are shown at higher magnification in D′-H′. (D′-H′) Tg(atoh1a:lifeact-egfp) signal intensity color-coded using the ‘Green Fire Blue’ lookup table. Arrowheads indicate MCs; arrows indicate dMCs. (I) Percentage of atoh1a+ cells with dMC morphology out of total number of atoh1a+ cells relative to SL. Each dot represents the mean dMC percentage calculated from n≥3 animals. For each animal, multiple images were acquired and grouped to calculate the dMC percentage. (J) Plot of dMC density relative to SL from the dataset in I. (K) Plot of total atoh1a+ cell density (dMCs and MCs) relative to SL from the dataset in I. Data are mean±s.d. (L,M) atoh1a+ cell shape analysis for animals of the indicated stages (n=100 randomly selected cells displayed from one animal for each stage). Dots represent individual atoh1a+ cells. Top right quadrant indicates cells with the most round and circular morphologies, indicative of MCs. Cells falling outside of the top right quadrant possess less round and circular morphologies, indicative of dMCs. (N) Stacked bar charts of atoh1a+ cell shape analysis performed in L and M. atoh1a+ cells in adult skin have significantly more circular morphologies than atoh1a+ cells in juvenile skin (****P<0.0001; Fisher's exact test). (O-O‴) Confocal images of the trunk epidermis from a TgBAC(ΔNp63:Cre-ERT2); Tg(actb2:LOXP-BFP-LOXP-DsRed); Tg(atoh1a:lifeact-egfp) juvenile treated with 4-OHT at 1 dpf. There is mosaic DsRed expression (magenta) in basal keratinocytes and derivatives. DsRed+ dMCs shown in O′ and O″, along with a DsRed+ MC in O‴, indicate that both are derived from basal keratinocytes. nm, neuromasts containing clusters of atoh1a+ hair cells. Scale bars: 50 µm in D-H; 20 µm in O; 5 µm in D′-H′,O′-O‴.

dMCs are the predominant atoh1a+ cell morphology during the early stages of skin regeneration. (A) Illustration of the scale pluck regeneration model. Physical plucking triggers regeneration of dermal scales and overlying epidermis. (B-I′) Representative images of scale-forming osteoblasts [magenta; Tg(sp7:mCherry)] (B-E) or atoh1a+ cells within the scale epidermis (F-I) at the indicated stages. Arrowheads indicate MCs; arrows indicate dMCs. Areas outlined in F-I are shown at higher magnification in F′-I′. (J) Plot of total atoh1a+ cell density (dMCs and MCs) throughout scale regeneration. Each dot represents a result from confocal images collected from multiple zebrafish of the corresponding timepoint (2-7 dpp, n=8-13 fish; 9-14 dpp, n=2-4 fish). Total cells analyzed: 5764 MCs and 1064 dMCs. Data are mean±s.d. (K) Quantification of dMC frequency during scale regeneration from the dataset in J. Each dot represents the mean dMC frequency±s.d. (L) Plot of dMC density throughout scale regeneration from the dataset in J. Data are mean±s.d. (M) Illustration depicting the atoh1a+ cell photoconversion paradigm. Tg(atoh1a:nls-eos) expresses nuclear-localized Eos in dMCs and MCs. UV light exposure irreversibly photoconverts atoh1a+ cells in uninjured scales. Scale plucking then induces regeneration. Pre-existing atoh1a+ cells contain photoconverted nls-Eos (magenta) in the new scale region, whereas new atoh1a+ cells contain only non-photoconverted nls-Eos (green). (N-Q′) Representative images of the photoconverted Tg(atoh1a:nls-eos) scale epidermis pre-scale pluck (N,N′) and post-pluck (O-Q′). Single channel images of the photoconverted nls-Eos channel (magenta) are shown in N-Q. Merged images of photoconverted (magenta) and non-photoconverted nls-Eos (green) are shown in N′-Q′. Arrowheads indicate pre-existing cells (containing photoconverted nls-Eos); arrows indicate de novo generated cells (containing only non-photoconverted nls-Eos). (R) Quantification of pre-existing and new atoh1a+ cells at the indicated stages. Each dot represents the mean atoh1a+ cell density from n=3 or 4 fish. Data are mean±s.d. Scale bars: 100 µm in B-E; 10 µm in F-I; 5 µm in F′-I′; 10 µm (N-Q′).

dMCs share molecular features with keratinocytes and MCs. (A-B′) Representative images of MCs and dMCs within the 5 dpp regenerating scale epidermis of a Tg(atoh1a:lifeact-egfp) adult visualized with an anti-Tp63 (magenta) antibody. Dashed lines outline the nuclei. SB, suprabasal keratinocytes; BK, basal keratinocytes. (C) Violin plots of Tp63 staining intensity in MCs, dMCs and basal keratinocytes (BKs). Each dot represents a cell (n=9 MCs,16 dMCs and 14 basal keratinocytes from three fish). A one-way ANOVA with post-hoc Tukey HSD test was used to compare between cell types. (D-E′) Representative images showing MCs and dMCs within the 5 dpp regenerating scale epidermis of a Tg(atoh1a:lifeact-egfp) adult stained with anti-SV2 (magenta) and anti-GFP (green) antibodies. Dashed lines outline the cell bodies. (F) Violin plots of SV2 staining intensity in MCs and dMCs. Each dot represents a cell (n=16 MCs and 22 dMCs from ≥7 fish). A non-parametric Mann–Whitney test was used to compare between cell types. (G) Bubble plot of the correlation between the circularity of Tg(atoh1a:lifeact-egfp)-expressing cells and normalized anti-SV2 staining intensity at 5 dpp. Bubble size and color represent the perimeter in µm, as shown in the key. Each bubble represents a cell (n=153 cells from five fish). (H,H′) Representative images of MCs and dMCs within the 5 dpp regenerating scale epidermis of a Tg(atoh1a:lifeact-egfp) adult stained with an anti-piezo2 HCR probeset (magenta) and an anti-GFP (green) antibody. Outlined areas are shown at higher magnification in the insets. (I) Violin plots of piezo2 HCR staining intensity in MCs and dMCs. Each dot represents a cell (n=19 MCs and 22 dMCs from five fish). A non-parametric Mann–Whitney test was used to compare between cell types (*P<0.05; ****P<0.0001). Scale bars: 5 µm in A-B′,D-E′ and insets in H,H′; 20 µm in H,H′.

MCs and dMCs occupy different epidermal strata and have distinct actin polarities. (A-C) Representative maximum intensity projection (A) or individual z-slices (B,C) of the scale epidermis. Tg(atoh1a:lifeact-egfp) labels dMCs and MCs (green), and (cdh1-tdTomato) labels keratinocyte membranes (magenta). (B′,C′) Reconstructed xz slices along the yellow lines in B and C. Dashed lines indicate the outer and inner epidermal margins. The MCs in B′ are located near the periderm layer of the skin with basal-facing protrusions (arrowhead), whereas the dMC in C′ is located near the basal layer of the skin with a lateral-facing protrusion (arrow). White dots and brackets indicate z-depth measurements used in D. Brightness and contrast have been adjusted in C and C′ to better illustrate dMC morphology. (D) Violin plots of z-depths of MCs and dMCs measured relative to the periderm surface of 130 MCs and 80 dMCs from five fish (11-12 mm SL). The lower dashed line indicates the average depth of the basal surface of basal keratinocytes in the data set (−16.4 µm). A non-parametric Mann–Whitney test was used to compare differences between cell types (****P<0.0001). (E-F′) Representative 3D reconstructions from z-stacks of a MC (E,E′) and a dMC (F,F′) stained with anti-GFP to label Tg(atoh1a:lifeact-egfp) and DAPI. Arrowheads indicate basal-facing microvilli; arrow indicates a laterally directed protrusion (see also Movies 1 and 2). (G) Polar histograms of MC and dMC protrusion angles. Lifeact-EGFP+ protrusions that could be individually resolved in 3D were measured relative to the z-axis of the epidermis, as diagrammed in H. Plots show 104 protrusions from 10 MCs (eight fish) and 32 protrusions from 11 dMCs (five fish). (H) Stacked bar charts depicting results in F, with protrusions binned based on orientation. A χ2 test was used to compare between cell types (****P<0.0001; χ2 statistic, 18.9903). Scale bars: 5 µm in A-C′,E,F.

dMCs are motile cells with mesenchymal-like behaviors. (A-A′′′′) Time-lapse stills of a MC expressing Tg(atoh1a:lifeact-egfp). White arrowheads indicate microvilli extension, retraction or merging events (see also Movie 3). (B-B′′′′) Time-lapse stills of a dMC visualized with Tg(atoh1a:lifeact-egfp). There are longer filopodial-like protrusions (white arrows) and an amorphous cell body (see also Movie 4). (C) Cell tracks (magenta) of individual MCs and dMCs over time (see also Movie 5). (D) Dot plot of cell speed of individual cells (n=60 MCs and 74 dMCs from four fish). A non-parametric Mann–Whitney test was used to compare between cell types (****P<0.0001). (E) Time-lapse stills from Tg(atoh1a:lifeact-egfp)-expressing juvenile skin. Magenta arrowheads indicate dMCs with unipolar protrusions. Orange arrowheads indicate dMCs with multipolar protrusions. Cells can switch between the unipolar and multipolar configurations. (F) Cell tracks scored for confinement ratio (n=74 dMCs from four fish). Values near 0 indicate confined movement and values near 1 indicate linear movement. (G) Paired dot plot of dMC track displacement, which measures the distance between the starting and ending point of each cell track, and total distance traveled (n=74 dMCs from four fish). A paired Mann–Whitney test was used to compare displacement and distance (****P<0.0001). In D and F, horizontal lines indicate the mean and error bars indicate the s.d. Scale bars: 5 µm in A-B⁗ and C, insets; 10 µm in C, E and E, insets.

dMCs can directly mature into MCs in developing and regenerating zebrafish skin. (A-C′) Representative images from a single Tg(atoh1a:nls-eos) fish before and after photoconversion of individual atoh1a+ nuclei during scale regeneration. Dashed outlines surround cells targeted for photoconversion. The insets in B and C contain the nuclear circularity index. (D) Left: paired dot plot of atoh1a+ nuclear circularity index at 0 and 24 h post-photoconversion (hpc) (n=24 cells total; four cells from two fish photoconverted at 4 dpp and re-imaged at 5 dpp; 20 cells from eight fish photoconverted at 5 dpp and re-imaged at 6 dpp). Right: paired dot plot of neighboring non-photoconverted MCs from the same cohort at 0 and 24 h (n=19 cells). A paired Mann–Whitney test was used to compare circularity values (***P<0.001; n.s., P=0.06728). (E) Time-lapse stills of a dMC to MC maturation event. Arrows indicate dMC protrusion retraction; arrowhead indicates formation of microvilli. The cell body transitions from an ovoid to a spherical shape. (F) Table summarizing observations from live imaging Tg(atoh1a:lifeact-egfp) during skin development and regeneration (see also Table S1 and Movie 7). (G) Schematic depicting the proposed model of dMC maturation events described in this study: (1) dMCs emerge in lower epidermal strata from ΔNp63+ embryonic basal keratinocyte progenitors; (2) dMCs migrate laterally in the direction of their protrusions; and (3) dMCs can directly adopt the mature MC morphology in upper epidermal strata. Scale bars: 20 µm in A-C′; 5 µm in E.

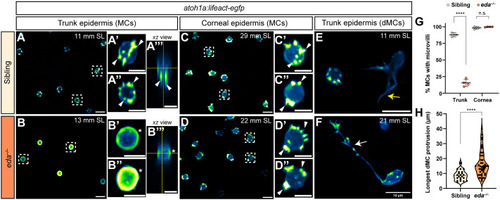
Genetic loss of Eda results in altered dMC and MC morphologies in trunk skin. (A-B‴) Representative confocal images of MCs within the trunk epidermis of the indicated genotypes. Dashed boxes indicate cells magnified in A′,A″,B′,B″. Arrowheads indicate microvilli. Asterisks indicate intense Lifeact-EGFP signal forming a smooth ring-like cortical structure evident in cross-section in the eda−/− mutant epidermis. (A‴,B‴) xz views of the cells shown in A′ and B′. (C-D″) Representative images of MCs within corneal epidermis of animals of the indicated genotypes. Dashed boxes indicate cells magnified in C′,C″,D′,D″. Arrowheads indicate microvilli. (E,F) Representative images of dMCs within the trunk epidermis of the indicated genotypes. Arrows indicate the longest protrusion on a dMC in eda sibling (E) or eda−/− mutant (F) epidermis. (G) Quantification of the percentage of MCs with discernable microvilli in trunk or corneal epidermis of the indicated genotypes. Each dot indicates an animal (9-20 mm SL) where a collection of images was analyzed (sibling trunk, n=386 cells from three fish; eda−/− trunk, n=235 cells from four fish; sibling cornea, n=169 cells from four fish; eda−/− cornea, n=332 cells from four fish). Fisher's exact test shows a significant difference between genotypes in the trunk but not cornea (****P<0.0001; n.s., P=0.3413). (H) Violin plots of the longest dMC Lifeact-EGFP+ protrusion within the trunk epidermis of juveniles of the indicated genotypes. Each dot represents a cell (siblings, n=22 dMCs from six fish; eda−/−, n=47 dMCs from four fish). A non-parametric Mann–Whitney test (****P<0.0001) was used to compare between cell types. Scales bars: 10 µm in A-F; 5 µm in A′-A‴,B′-B‴,C′-C″,D′-D″.

Skin exfoliation induces MC regeneration and genetic loss of Eda results in altered MC morphology in regeneration. (A) Schematic of the exfoliation method used to induce epidermal regeneration. (B) Schematic of the effects of exfoliation on the epidermis based on results in sibling fish. Exfoliation induces regeneration of superficial keratinocytes, dMCs and MCs by 7 days post-exfoliation (dpe). (C-J) Representative images of Tg(atoh1a:lifeact-egfp) within the adult trunk epidermis of the indicated genotypes. Dashed boxes indicate cells magnified in insets. Arrowheads indicate microvilli; asterisks indicate ring-like cortical Lifeact-EGFP signal. (C′-J′) Reconstructed orthogonal slices of (cdh1-tdTomato) showing the epidermal structure of the indicated genotypes. Dashed lines in C′ and G′ indicate the outer and inner epidermal margins. (K,L) Box plots of the density of MCs (K) or dMCs (L) in sibling or eda−/− mutant skin during exfoliation-induced regeneration. (M) Box plots of the percentage of MCs with discernable microvilli in the trunk epidermis of animals of the indicated genotypes during regeneration. In K-M, each dot indicates an adult zebrafish (19-33 mm SL) where a collection of images were analyzed. Total atoh1a+ cells analyzed: uninjured sibling trunk, n=700 cells from 12 fish; exfoliated (0 dpe) sibling trunk, n=14 cells from 12 fish; 4 dpe sibling trunk, n=337 cells from 12 fish; 7 dpe sibling trunk, n=344 cells from 11 fish; uninjured eda−/− trunk, n=647 cells from 12 fish; exfoliated (0 dpe) eda−/− trunk, n=1 cell from 12 fish; 4 dpe eda−/− trunk, n=164 cells from 12 fish; 7 dpe eda−/− trunk, n=194 cells from 11 fish. P values were determined by linear mixed-effects modeling with the Giesser-Greenhouse sphericity correction and Šidák's correction for multiple comparisons (****P<0.0001; ***P<0.001). Test results are reported in Table S2. In K-M, the boxes span the first and third quartiles, the horizontal line indicates the median and the whiskers extend to 1.5 times the interquartile range. Scale bars: 10 µm in C-J′; 2 µm in insets in C,E-G,I,J.

Acknowledgments
This image is the copyrighted work of the attributed author or publisher, and ZFIN has permission only to display this image to its users. Additional permissions should be obtained from the applicable author or publisher of the image. Full text @ Development