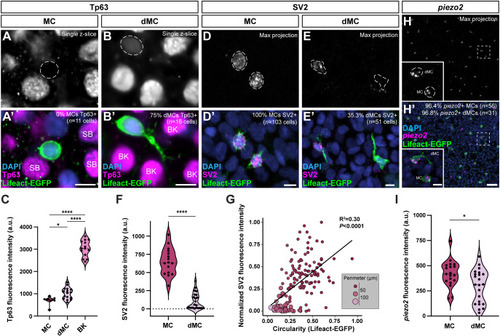
dMCs share molecular features with keratinocytes and MCs. (A-B′) Representative images of MCs and dMCs within the 5 dpp regenerating scale epidermis of a Tg(atoh1a:lifeact-egfp) adult visualized with an anti-Tp63 (magenta) antibody. Dashed lines outline the nuclei. SB, suprabasal keratinocytes; BK, basal keratinocytes. (C) Violin plots of Tp63 staining intensity in MCs, dMCs and basal keratinocytes (BKs). Each dot represents a cell (n=9 MCs,16 dMCs and 14 basal keratinocytes from three fish). A one-way ANOVA with post-hoc Tukey HSD test was used to compare between cell types. (D-E′) Representative images showing MCs and dMCs within the 5 dpp regenerating scale epidermis of a Tg(atoh1a:lifeact-egfp) adult stained with anti-SV2 (magenta) and anti-GFP (green) antibodies. Dashed lines outline the cell bodies. (F) Violin plots of SV2 staining intensity in MCs and dMCs. Each dot represents a cell (n=16 MCs and 22 dMCs from ≥7 fish). A non-parametric Mann–Whitney test was used to compare between cell types. (G) Bubble plot of the correlation between the circularity of Tg(atoh1a:lifeact-egfp)-expressing cells and normalized anti-SV2 staining intensity at 5 dpp. Bubble size and color represent the perimeter in µm, as shown in the key. Each bubble represents a cell (n=153 cells from five fish). (H,H′) Representative images of MCs and dMCs within the 5 dpp regenerating scale epidermis of a Tg(atoh1a:lifeact-egfp) adult stained with an anti-piezo2 HCR probeset (magenta) and an anti-GFP (green) antibody. Outlined areas are shown at higher magnification in the insets. (I) Violin plots of piezo2 HCR staining intensity in MCs and dMCs. Each dot represents a cell (n=19 MCs and 22 dMCs from five fish). A non-parametric Mann–Whitney test was used to compare between cell types (*P<0.05; ****P<0.0001). Scale bars: 5 µm in A-B′,D-E′ and insets in H,H′; 20 µm in H,H′.
|
