IMAGE

Fig. 8.

ID
ZDB-IMAGE-250703-38
Source
Figures for Craig et al., 2025
Image
Figure Caption

Fig. 8.

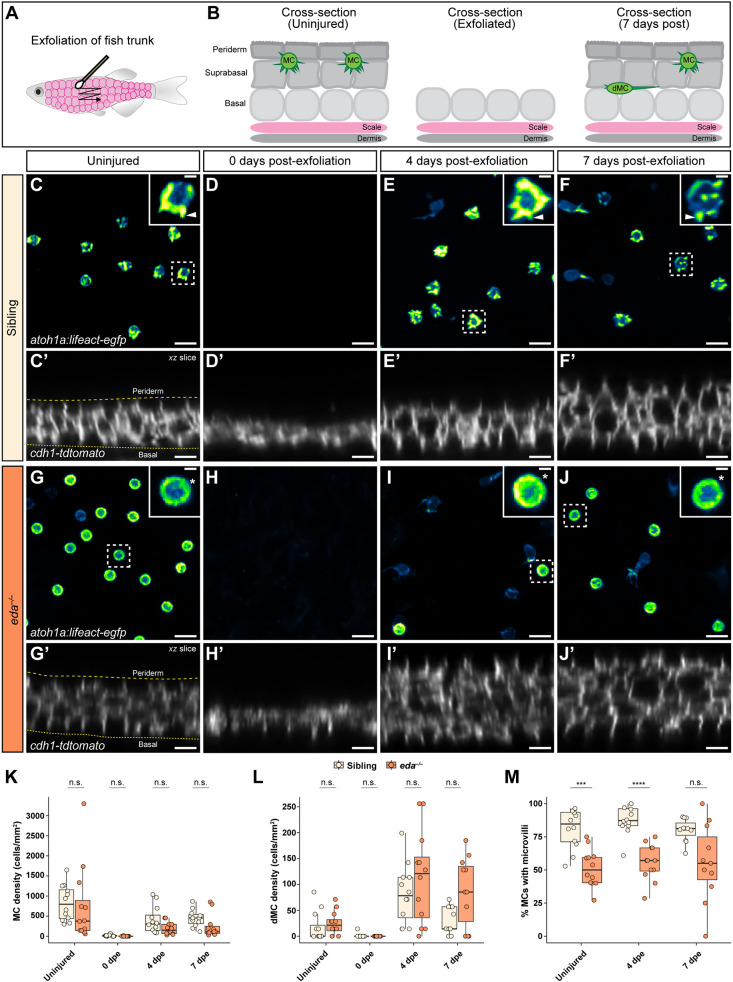
Skin exfoliation induces MC regeneration and genetic loss of Eda results in altered MC morphology in regeneration. (A) Schematic of the exfoliation method used to induce epidermal regeneration. (B) Schematic of the effects of exfoliation on the epidermis based on results in sibling fish. Exfoliation induces regeneration of superficial keratinocytes, dMCs and MCs by 7 days post-exfoliation (dpe). (C-J) Representative images of Tg(atoh1a:lifeact-egfp) within the adult trunk epidermis of the indicated genotypes. Dashed boxes indicate cells magnified in insets. Arrowheads indicate microvilli; asterisks indicate ring-like cortical Lifeact-EGFP signal. (C′-J′) Reconstructed orthogonal slices of (cdh1-tdTomato) showing the epidermal structure of the indicated genotypes. Dashed lines in C′ and G′ indicate the outer and inner epidermal margins. (K,L) Box plots of the density of MCs (K) or dMCs (L) in sibling or eda−/− mutant skin during exfoliation-induced regeneration. (M) Box plots of the percentage of MCs with discernable microvilli in the trunk epidermis of animals of the indicated genotypes during regeneration. In K-M, each dot indicates an adult zebrafish (19-33 mm SL) where a collection of images were analyzed. Total atoh1a+ cells analyzed: uninjured sibling trunk, n=700 cells from 12 fish; exfoliated (0 dpe) sibling trunk, n=14 cells from 12 fish; 4 dpe sibling trunk, n=337 cells from 12 fish; 7 dpe sibling trunk, n=344 cells from 11 fish; uninjured eda−/− trunk, n=647 cells from 12 fish; exfoliated (0 dpe) eda−/− trunk, n=1 cell from 12 fish; 4 dpe eda−/− trunk, n=164 cells from 12 fish; 7 dpe eda−/− trunk, n=194 cells from 11 fish. P values were determined by linear mixed-effects modeling with the Giesser-Greenhouse sphericity correction and Šidák's correction for multiple comparisons (****P<0.0001; ***P<0.001). Test results are reported in Table S2. In K-M, the boxes span the first and third quartiles, the horizontal line indicates the median and the whiskers extend to 1.5 times the interquartile range. Scale bars: 10 µm in C-J′; 2 µm in insets in C,E-G,I,J.

Acknowledgments
This image is the copyrighted work of the attributed author or publisher, and ZFIN has permission only to display this image to its users. Additional permissions should be obtained from the applicable author or publisher of the image. Full text @ Development