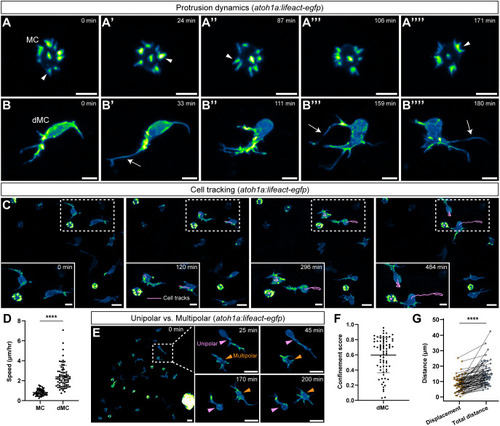
dMCs are motile cells with mesenchymal-like behaviors. (A-A′′′′) Time-lapse stills of a MC expressing Tg(atoh1a:lifeact-egfp). White arrowheads indicate microvilli extension, retraction or merging events (see also Movie 3). (B-B′′′′) Time-lapse stills of a dMC visualized with Tg(atoh1a:lifeact-egfp). There are longer filopodial-like protrusions (white arrows) and an amorphous cell body (see also Movie 4). (C) Cell tracks (magenta) of individual MCs and dMCs over time (see also Movie 5). (D) Dot plot of cell speed of individual cells (n=60 MCs and 74 dMCs from four fish). A non-parametric Mann–Whitney test was used to compare between cell types (****P<0.0001). (E) Time-lapse stills from Tg(atoh1a:lifeact-egfp)-expressing juvenile skin. Magenta arrowheads indicate dMCs with unipolar protrusions. Orange arrowheads indicate dMCs with multipolar protrusions. Cells can switch between the unipolar and multipolar configurations. (F) Cell tracks scored for confinement ratio (n=74 dMCs from four fish). Values near 0 indicate confined movement and values near 1 indicate linear movement. (G) Paired dot plot of dMC track displacement, which measures the distance between the starting and ending point of each cell track, and total distance traveled (n=74 dMCs from four fish). A paired Mann–Whitney test was used to compare displacement and distance (****P<0.0001). In D and F, horizontal lines indicate the mean and error bars indicate the s.d. Scale bars: 5 µm in A-B⁗ and C, insets; 10 µm in C, E and E, insets.
|
