IMAGE

Fig. 2.

ID
ZDB-IMAGE-250703-32
Source
Figures for Craig et al., 2025
Image
Figure Caption

Fig. 2.

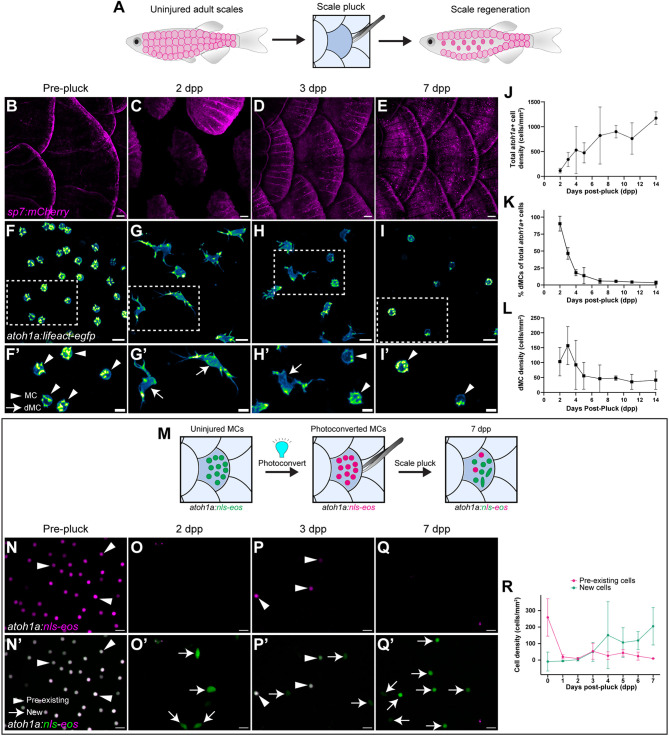
dMCs are the predominant atoh1a+ cell morphology during the early stages of skin regeneration. (A) Illustration of the scale pluck regeneration model. Physical plucking triggers regeneration of dermal scales and overlying epidermis. (B-I′) Representative images of scale-forming osteoblasts [magenta; Tg(sp7:mCherry)] (B-E) or atoh1a+ cells within the scale epidermis (F-I) at the indicated stages. Arrowheads indicate MCs; arrows indicate dMCs. Areas outlined in F-I are shown at higher magnification in F′-I′. (J) Plot of total atoh1a+ cell density (dMCs and MCs) throughout scale regeneration. Each dot represents a result from confocal images collected from multiple zebrafish of the corresponding timepoint (2-7 dpp, n=8-13 fish; 9-14 dpp, n=2-4 fish). Total cells analyzed: 5764 MCs and 1064 dMCs. Data are mean±s.d. (K) Quantification of dMC frequency during scale regeneration from the dataset in J. Each dot represents the mean dMC frequency±s.d. (L) Plot of dMC density throughout scale regeneration from the dataset in J. Data are mean±s.d. (M) Illustration depicting the atoh1a+ cell photoconversion paradigm. Tg(atoh1a:nls-eos) expresses nuclear-localized Eos in dMCs and MCs. UV light exposure irreversibly photoconverts atoh1a+ cells in uninjured scales. Scale plucking then induces regeneration. Pre-existing atoh1a+ cells contain photoconverted nls-Eos (magenta) in the new scale region, whereas new atoh1a+ cells contain only non-photoconverted nls-Eos (green). (N-Q′) Representative images of the photoconverted Tg(atoh1a:nls-eos) scale epidermis pre-scale pluck (N,N′) and post-pluck (O-Q′). Single channel images of the photoconverted nls-Eos channel (magenta) are shown in N-Q. Merged images of photoconverted (magenta) and non-photoconverted nls-Eos (green) are shown in N′-Q′. Arrowheads indicate pre-existing cells (containing photoconverted nls-Eos); arrows indicate de novo generated cells (containing only non-photoconverted nls-Eos). (R) Quantification of pre-existing and new atoh1a+ cells at the indicated stages. Each dot represents the mean atoh1a+ cell density from n=3 or 4 fish. Data are mean±s.d. Scale bars: 100 µm in B-E; 10 µm in F-I; 5 µm in F′-I′; 10 µm (N-Q′).

Acknowledgments
This image is the copyrighted work of the attributed author or publisher, and ZFIN has permission only to display this image to its users. Additional permissions should be obtained from the applicable author or publisher of the image. Full text @ Development