IMAGE

Fig. 1.

ID
ZDB-IMAGE-250703-31
Source
Figures for Craig et al., 2025
Image
Figure Caption

Fig. 1.

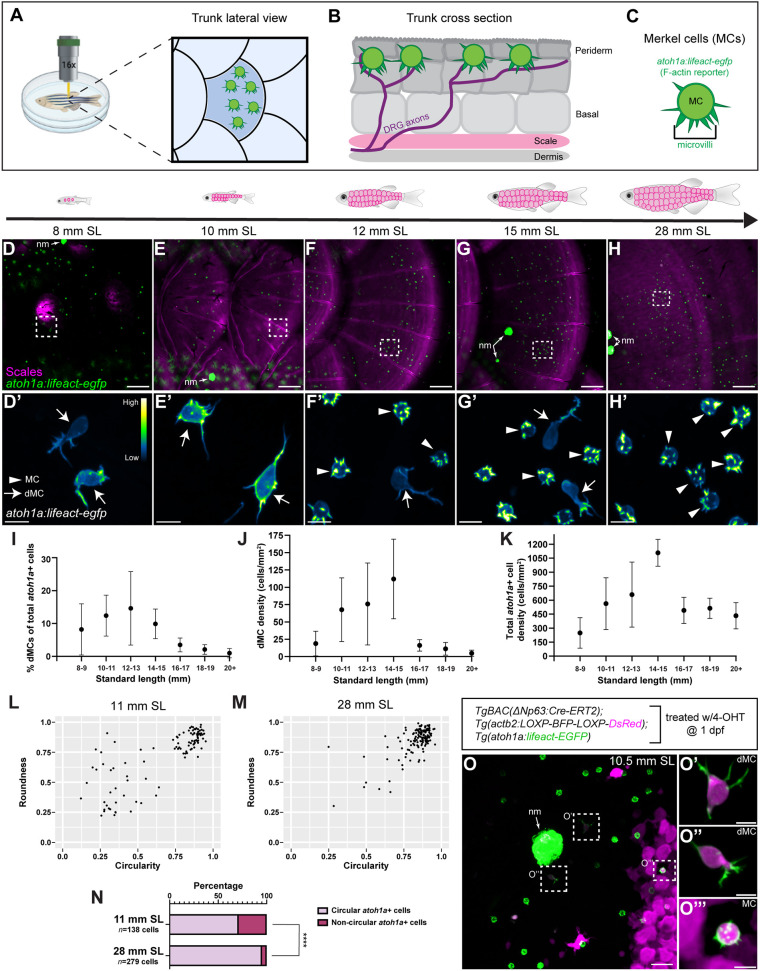
Identification of a transient and morphologically distinct population of keratinocyte-derived atoh1a+ cells during skin development. (A) Schematic of live-imaging methodology for visualizing MCs (green) along the lateral zebrafish trunk. (B) Illustration of adult trunk skin in cross-section. Stratified layers of keratinocytes with interspersed MCs (green) reside above the bony scale (pink). (C) Tg(atoh1a:lifeact-egfp) allows visualization of the MC F-actin cytoskeleton, including microvilli. (D-H) Representative images of atoh1a+ MCs [green; Tg(atoh1a:lifeact-egfp)] and scales (magenta; Alizarin Red S staining) along the lateral trunk at the indicated stages. Regions outlined in D-H are shown at higher magnification in D′-H′. (D′-H′) Tg(atoh1a:lifeact-egfp) signal intensity color-coded using the ‘Green Fire Blue’ lookup table. Arrowheads indicate MCs; arrows indicate dMCs. (I) Percentage of atoh1a+ cells with dMC morphology out of total number of atoh1a+ cells relative to SL. Each dot represents the mean dMC percentage calculated from n≥3 animals. For each animal, multiple images were acquired and grouped to calculate the dMC percentage. (J) Plot of dMC density relative to SL from the dataset in I. (K) Plot of total atoh1a+ cell density (dMCs and MCs) relative to SL from the dataset in I. Data are mean±s.d. (L,M) atoh1a+ cell shape analysis for animals of the indicated stages (n=100 randomly selected cells displayed from one animal for each stage). Dots represent individual atoh1a+ cells. Top right quadrant indicates cells with the most round and circular morphologies, indicative of MCs. Cells falling outside of the top right quadrant possess less round and circular morphologies, indicative of dMCs. (N) Stacked bar charts of atoh1a+ cell shape analysis performed in L and M. atoh1a+ cells in adult skin have significantly more circular morphologies than atoh1a+ cells in juvenile skin (****P<0.0001; Fisher's exact test). (O-O‴) Confocal images of the trunk epidermis from a TgBAC(ΔNp63:Cre-ERT2); Tg(actb2:LOXP-BFP-LOXP-DsRed); Tg(atoh1a:lifeact-egfp) juvenile treated with 4-OHT at 1 dpf. There is mosaic DsRed expression (magenta) in basal keratinocytes and derivatives. DsRed+ dMCs shown in O′ and O″, along with a DsRed+ MC in O‴, indicate that both are derived from basal keratinocytes. nm, neuromasts containing clusters of atoh1a+ hair cells. Scale bars: 50 µm in D-H; 20 µm in O; 5 µm in D′-H′,O′-O‴.

Acknowledgments
This image is the copyrighted work of the attributed author or publisher, and ZFIN has permission only to display this image to its users. Additional permissions should be obtained from the applicable author or publisher of the image. Full text @ Development