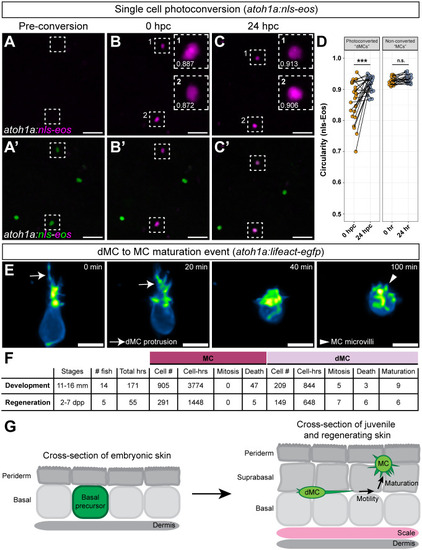
dMCs can directly mature into MCs in developing and regenerating zebrafish skin. (A-C′) Representative images from a single Tg(atoh1a:nls-eos) fish before and after photoconversion of individual atoh1a+ nuclei during scale regeneration. Dashed outlines surround cells targeted for photoconversion. The insets in B and C contain the nuclear circularity index. (D) Left: paired dot plot of atoh1a+ nuclear circularity index at 0 and 24 h post-photoconversion (hpc) (n=24 cells total; four cells from two fish photoconverted at 4 dpp and re-imaged at 5 dpp; 20 cells from eight fish photoconverted at 5 dpp and re-imaged at 6 dpp). Right: paired dot plot of neighboring non-photoconverted MCs from the same cohort at 0 and 24 h (n=19 cells). A paired Mann–Whitney test was used to compare circularity values (***P<0.001; n.s., P=0.06728). (E) Time-lapse stills of a dMC to MC maturation event. Arrows indicate dMC protrusion retraction; arrowhead indicates formation of microvilli. The cell body transitions from an ovoid to a spherical shape. (F) Table summarizing observations from live imaging Tg(atoh1a:lifeact-egfp) during skin development and regeneration (see also Table S1 and Movie 7). (G) Schematic depicting the proposed model of dMC maturation events described in this study: (1) dMCs emerge in lower epidermal strata from ΔNp63+ embryonic basal keratinocyte progenitors; (2) dMCs migrate laterally in the direction of their protrusions; and (3) dMCs can directly adopt the mature MC morphology in upper epidermal strata. Scale bars: 20 µm in A-C′; 5 µm in E.
|
