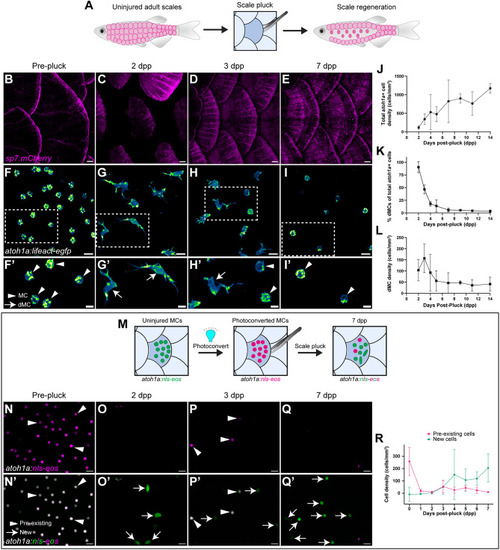
dMCs are the predominant atoh1a+ cell morphology during the early stages of skin regeneration. (A) Illustration of the scale pluck regeneration model. Physical plucking triggers regeneration of dermal scales and overlying epidermis. (B-I′) Representative images of scale-forming osteoblasts [magenta; Tg(sp7:mCherry)] (B-E) or atoh1a+ cells within the scale epidermis (F-I) at the indicated stages. Arrowheads indicate MCs; arrows indicate dMCs. Areas outlined in F-I are shown at higher magnification in F′-I′. (J) Plot of total atoh1a+ cell density (dMCs and MCs) throughout scale regeneration. Each dot represents a result from confocal images collected from multiple zebrafish of the corresponding timepoint (2-7 dpp, n=8-13 fish; 9-14 dpp, n=2-4 fish). Total cells analyzed: 5764 MCs and 1064 dMCs. Data are mean±s.d. (K) Quantification of dMC frequency during scale regeneration from the dataset in J. Each dot represents the mean dMC frequency±s.d. (L) Plot of dMC density throughout scale regeneration from the dataset in J. Data are mean±s.d. (M) Illustration depicting the atoh1a+ cell photoconversion paradigm. Tg(atoh1a:nls-eos) expresses nuclear-localized Eos in dMCs and MCs. UV light exposure irreversibly photoconverts atoh1a+ cells in uninjured scales. Scale plucking then induces regeneration. Pre-existing atoh1a+ cells contain photoconverted nls-Eos (magenta) in the new scale region, whereas new atoh1a+ cells contain only non-photoconverted nls-Eos (green). (N-Q′) Representative images of the photoconverted Tg(atoh1a:nls-eos) scale epidermis pre-scale pluck (N,N′) and post-pluck (O-Q′). Single channel images of the photoconverted nls-Eos channel (magenta) are shown in N-Q. Merged images of photoconverted (magenta) and non-photoconverted nls-Eos (green) are shown in N′-Q′. Arrowheads indicate pre-existing cells (containing photoconverted nls-Eos); arrows indicate de novo generated cells (containing only non-photoconverted nls-Eos). (R) Quantification of pre-existing and new atoh1a+ cells at the indicated stages. Each dot represents the mean atoh1a+ cell density from n=3 or 4 fish. Data are mean±s.d. Scale bars: 100 µm in B-E; 10 µm in F-I; 5 µm in F′-I′; 10 µm (N-Q′).
|
