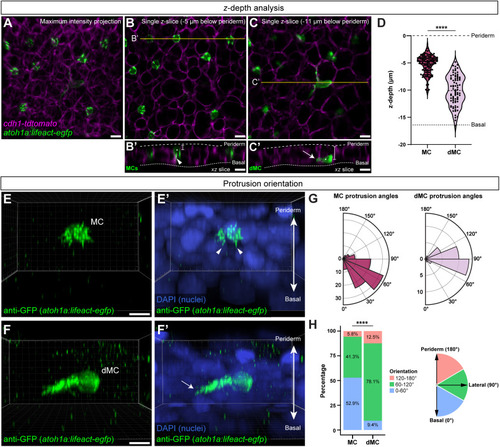
MCs and dMCs occupy different epidermal strata and have distinct actin polarities. (A-C) Representative maximum intensity projection (A) or individual z-slices (B,C) of the scale epidermis. Tg(atoh1a:lifeact-egfp) labels dMCs and MCs (green), and (cdh1-tdTomato) labels keratinocyte membranes (magenta). (B′,C′) Reconstructed xz slices along the yellow lines in B and C. Dashed lines indicate the outer and inner epidermal margins. The MCs in B′ are located near the periderm layer of the skin with basal-facing protrusions (arrowhead), whereas the dMC in C′ is located near the basal layer of the skin with a lateral-facing protrusion (arrow). White dots and brackets indicate z-depth measurements used in D. Brightness and contrast have been adjusted in C and C′ to better illustrate dMC morphology. (D) Violin plots of z-depths of MCs and dMCs measured relative to the periderm surface of 130 MCs and 80 dMCs from five fish (11-12 mm SL). The lower dashed line indicates the average depth of the basal surface of basal keratinocytes in the data set (−16.4 µm). A non-parametric Mann–Whitney test was used to compare differences between cell types (****P<0.0001). (E-F′) Representative 3D reconstructions from z-stacks of a MC (E,E′) and a dMC (F,F′) stained with anti-GFP to label Tg(atoh1a:lifeact-egfp) and DAPI. Arrowheads indicate basal-facing microvilli; arrow indicates a laterally directed protrusion (see also Movies 1 and 2). (G) Polar histograms of MC and dMC protrusion angles. Lifeact-EGFP+ protrusions that could be individually resolved in 3D were measured relative to the z-axis of the epidermis, as diagrammed in H. Plots show 104 protrusions from 10 MCs (eight fish) and 32 protrusions from 11 dMCs (five fish). (H) Stacked bar charts depicting results in F, with protrusions binned based on orientation. A χ2 test was used to compare between cell types (****P<0.0001; χ2 statistic, 18.9903). Scale bars: 5 µm in A-C′,E,F.
|
