IMAGE

Fig. 6.

ID
ZDB-IMAGE-250703-36
Source
Figures for Craig et al., 2025
Image
Figure Caption

Fig. 6.

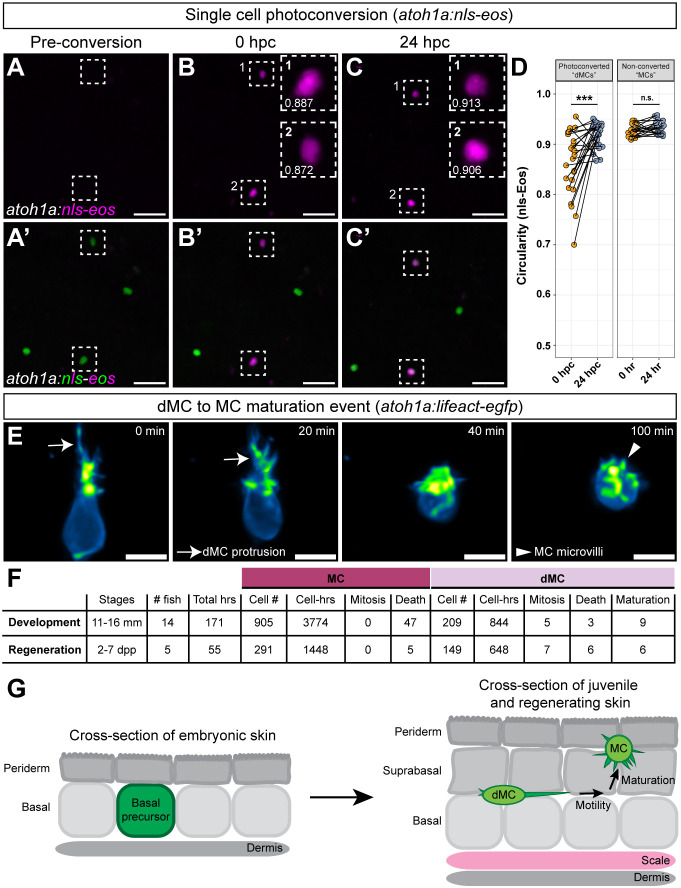
dMCs can directly mature into MCs in developing and regenerating zebrafish skin. (A-C′) Representative images from a single Tg(atoh1a:nls-eos) fish before and after photoconversion of individual atoh1a+ nuclei during scale regeneration. Dashed outlines surround cells targeted for photoconversion. The insets in B and C contain the nuclear circularity index. (D) Left: paired dot plot of atoh1a+ nuclear circularity index at 0 and 24 h post-photoconversion (hpc) (n=24 cells total; four cells from two fish photoconverted at 4 dpp and re-imaged at 5 dpp; 20 cells from eight fish photoconverted at 5 dpp and re-imaged at 6 dpp). Right: paired dot plot of neighboring non-photoconverted MCs from the same cohort at 0 and 24 h (n=19 cells). A paired Mann–Whitney test was used to compare circularity values (***P<0.001; n.s., P=0.06728). (E) Time-lapse stills of a dMC to MC maturation event. Arrows indicate dMC protrusion retraction; arrowhead indicates formation of microvilli. The cell body transitions from an ovoid to a spherical shape. (F) Table summarizing observations from live imaging Tg(atoh1a:lifeact-egfp) during skin development and regeneration (see also Table S1 and Movie 7). (G) Schematic depicting the proposed model of dMC maturation events described in this study: (1) dMCs emerge in lower epidermal strata from ΔNp63+ embryonic basal keratinocyte progenitors; (2) dMCs migrate laterally in the direction of their protrusions; and (3) dMCs can directly adopt the mature MC morphology in upper epidermal strata. Scale bars: 20 µm in A-C′; 5 µm in E.

Acknowledgments
This image is the copyrighted work of the attributed author or publisher, and ZFIN has permission only to display this image to its users. Additional permissions should be obtained from the applicable author or publisher of the image. Full text @ Development