FIGURE SUMMARY
Title

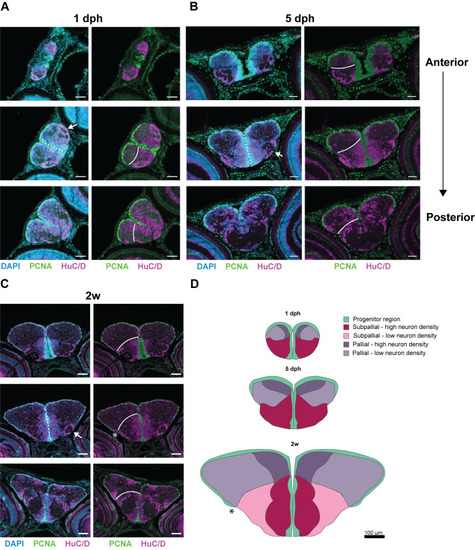
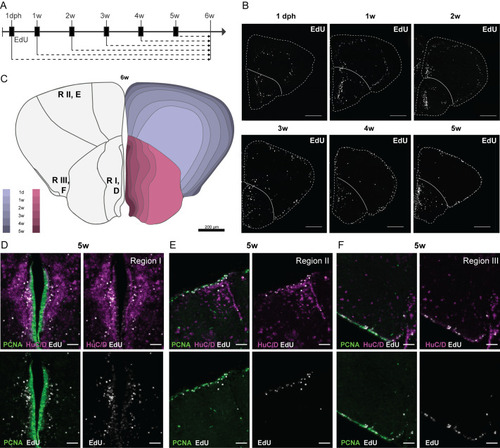
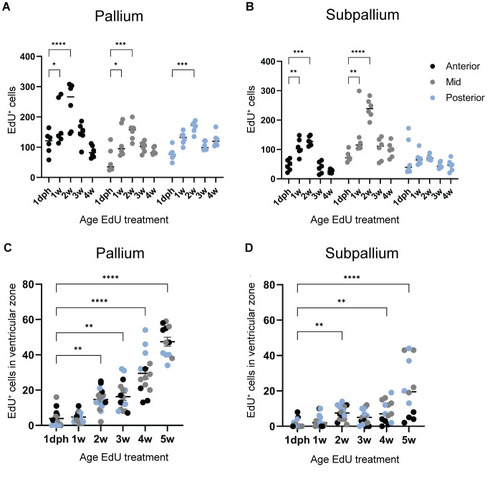
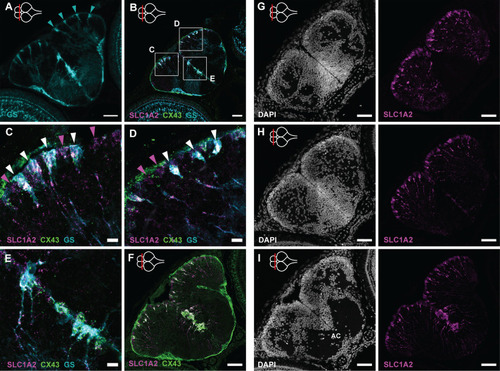
Early-life growth and cellular heterogeneity in the short-lived African turquoise killifish telencephalon

Authors
Zandecki, C., Mariën, V., Ayana, R., Van Houcke, J., Arckens, L., Seuntjens, E.
Source
Full text @ Biol. Open

Explosive growth of dorsal and ventral telencephalic domains. (A-C) Immunohistochemical staining for PCNA (green) and HuC/D (magenta) in combination with a nuclear stain (DAPI, blue) in coronal brain sections. Three levels of the anterior-posterior axis – anterior-mid-posterior – are shown for killifish at 1 dph (A), 5 dph (B) and 2 weeks (C), from anterior to posterior. White lines represent the pallial-subpallial border. (D) On scale illustration summarizing the distribution of progenitor (green) and neuronal regions (shades of red/pink/purple) on coronal telencephalic sections of juveniles at 1 dph, 5 dph, and 2 weeks. Example sections of a comparable anterior-posterior level were selected based on the presence of a specific ventrolateral neuronal cluster (arrows, A-C) and the progenitor region extending from the dorsal to the ventral surface (dashed lines, A-C). (A-B) Scale bars: 50 µm (A,B); 100 µm (C,D). dph, days post-hatching; w, week.

EdU tracing reveals a neuronal stacking process during telencephalic growth. (A) Design of the EdU birth-dating experiment. Each experimental group is exposed to 4 mM EdU for 16 h (black boxes) at different time points during development. EdU is incorporated into the DNA of dividing cells; their progeny are always traced until 6 weeks. (B) Distribution of EdU+ nuclei (white) on coronal sections at the mid-anterior-posterior level at 6 weeks. The timepoint of EdU administration is indicated above each panel. The outer border of the sections is indicated with a dashed line and the pallial-subpallial border with a solid line. In the pallium, EdU+ cells appear in concentric circles at differing distances from and parallel to the pallial surface. In the subpallium, the EdU+ cells appear more scattered, but the bulk of EdU+ cells seem to have migrated a comparable distance from the subpallial ventricular zone for each timepoint of EdU treatment. (C) Illustrative summary of the EdU tracing experiment. The opposite stacking process of the pallium and subpallium is color-coded for each period. The location of the pictures in D-F [neurogenic region (R) I, II, III] is indicated on the left hemisphere. (D-F) Zoom-in on EdU+ cells at each neurogenic region upon EdU treatment at 5 weeks. The EdU staining (white) is combined with an immunohistochemical staining for HuC/D (magenta) and PCNA (green). After 1 week of tracing from 5 weeks, the EdU signal is visible in the PCNA+ progenitor cells and HuC/D+ neurons at a distance from the ventricular zone. Note that region I contains more EdU+/HUC/D+ cells than regions II and III. A varying degree of EdU intensity is observed in the PCNA+ progenitors. Scale bars: 200 µm (B); 50 µm (D-F).

Different pallial and subpallial growth dynamics identified by EdU tracing. (A,B) The absolute number of EdU+ cells was quantified in 6-week-old coronal sections for both pallial (A) and subpallial (B) regions. Sections spanning the anterior-posterior axis were categorized into three levels: anterior, mid and posterior. Quantification was performed at each level for six individual hemispheres (n=6) from three fish per time point. Statistical analysis was conducted using a two-way ANOVA followed by post-hoc multiple comparisons against 1 dph. (C,D) To evaluate EdU label retention in progenitor cells, EdU+ cells located one to two cell bodies from the pallial ventricular surface (C) and subpallial midline (D) were quantified for each timepoint after tracing until 6 weeks. Quantifications were performed using individual hemispheres spanning the anterior-posterior axis. A minimum of two fish were used per time point (1 dph, n=14; 1 weeks, n=14; 2 weeks, n=16; 3 weeks, n=16; 4 weeks, n=14; 5 weeks, n=12). Statistical analysis was conducted using a Kruskal–Wallis test with post-hoc multiple comparisons against 1 dph. *P<0.05, **P<0.01, ***P<0.001, ****P<0.0001.

Radial glia patterns in the developing telencephalon. (A) Immunohistochemical staining of GS (turquoise) on a 5 dph telencephalon section at a posterior level. Isolated GS+ RGs are positioned one by one at the pallial surface (turquoise arrowheads) and in a dense cluster at the subpallial midline. (B) HCR-FISH targeting SLC1A2 (magenta) and CX43 (green) in combination with the immunohistochemical GS (turquoise) staining on a coronal section at the mid-anterior-posterior level. (C-E) Magnification of the squares in B. GS+/SLC1A2+/CX43+ RGs (white arrowheads) are interspersed with SLC1A2+-only RGs (magenta arrowheads), which are most probably not fully mature yet, at the pallial surface. (F) HCR-FISH targeting SLC1A2 (magenta) and CX43 (green) on a coronal section of the posterior telencephalon at 5 dph. At the midline, a dense cluster of CX43+SLC1A2+ RGs could be identified as the astroglia subcluster Astro-RG2. (G-I) Coronal sections of the telencephalon at 5 dph along the anterior-posterior axis. Left panels show the nuclear stain DAPI (white) to delineate the nuclear composition and density of the telencephalic domains. Right panels display HCR-FISH targeting SLC1A2 (magenta). Cell bodies, at the ventricular surface, and fiber structures, running towards the pia, are visible on all levels. The anterior-posterior position of the sections is indicated with a red line on a top-view illustration of the brain in the upper-left corner of the panels. Scale bars: 50 µm (A,B,F-I); 10 µm (C-E). AC, anterior commissure; HCR-FISH, hybridization chain reaction–fluorescent in situ hybridization.

Distribution of the non-glial and neuroepithelial-like progenitors. (A-C) HCR-FISH targeting NGPmix (STMN1A+HMGB2A, NGPs, turquoise) and ZIC2 (NE-RGs, yellow) in combination with immunohistochemical staining for the progenitor marker SOX2 (magenta) on coronal sections along the anterior-posterior axis in the 5 dph telencephalon. (D,E) Magnifications of the regions in the boxes in B and C. The HCR-FISH targeting ZIC2 (yellow) and NGPmix (turquoise) and SOX2 staining (magenta) are combined with the nuclear stain DAPI (white). NGPs and NE-RGs are present in the subpallial midline and posterior pallial neurogenic regions. In the subpallium, both cell types retain their progenitor profile (SOX2+), while in the pallium, NE-RG3 loses its progenitor profile (SOX2) in the parenchyme. Scale bars: 50 µm (A-C); 10 µm (D,E).

Progenitor heterogeneity in the developing telencephalon. (A,B) Adjacent coronal sections of the telencephalon at 5 dph along the anterior-posterior axis. The level of each section is indicated with a red line on the top-view brain illustration in the upper-left corner of each panel in A. HCR-FISH targeting CX43 (pan Astro-RG, magenta) and ZIC2 (NE-RG, yellow) (A) or NGPmix (turquoise) (B), is combined with immunohistochemical staining for the proliferation marker PCNA (white). NGPs account for the bulk of proliferation; Astro-RGs and NE-RGs appear both dividing and non-dividing depending on the location in the telencephalon. (C-E) Magnifications of the regions in the boxes in A and B. Non-dividing Astro-RGs (CX43+, PCNA) are indicated with a magenta arrowhead and appear isolated in between stretches of dividing NGPs. (F) Illustration of a 5 dph coronal telencephalic section at mid-anterior-posterior level. The distribution of dividing and non-dividing Astro-RGs, NE-RGs and NGPs is displayed in the ventricular zone. Scale bars: 50 µm (A,B); 20 µm (C-E).

Intermediate progenitors in the killifish pallium. (A) HCR-FISH targeting CX43 (Astro-RGs, yellow), NGPmix (turquoise) and the immature excitatory neuron marker EOMESA (magenta) in combination with the nuclear stain DAPI (white) on a coronal section of the telencephalon at 5 dph. The anterior-posterior level is depicted with a red line on the top-view brain illustration in the upper-left corner. (B-D) Magnifications of the regions in the boxes in A. Intermediate progenitors (EOMESA+/NGPmix+) are found at the pallial neurogenic region and ventral subpallium, dispersed in between Astro-RGs (only in pallium) and NGPs. (E,F) HCR-FISH targeting EOMESA (magenta) in combination with immunohistochemical staining for the proliferation marker PCNA (white). The panels are magnifications of zones on a section of a comparable anterior-posterior level as in A. E and F are magnifications of the lateral pallium and dorsal midline, respectively. Proliferating PCNA+/EOMESA+ progenitors are present at the midline and pallial surface. Scale bars: 50 µm (A); 10 µm (B-F).

Excitatory and inhibitory neurons in the 5 dph telencephalon. (A-C) Coronal sections of the telencephalon at 5 dph along the anterior-posterior axis. HCR-FISH targeting DLX1 (magenta) and GAD1B (turquoise) mRNA expression shows the distribution of immature and mature inhibitory neurons, respectively. (D-F) Adjacent coronal sections of A-C; HCR-FISH targeting EOMESA (magenta), SLC17A7 (yellow) and GAD1B (turquoise) mRNA expression shows the distribution of immature and mature excitatory neurons, and the mature inhibitory neurons, respectively. The anterior-posterior position of the sections is indicated with a red line on the top-view brain illustration in the upper-left corner of A-C. The border of the telencephalon (posterior-most section, C,F) is recognizable based on the presence of the habenula on top of the dorsal pallial surface, positive for SLC17A7. (G) Magnification of the region in the box in A. HCR-FISH labeling DLX1 and GAD1B in combination with a nuclear stain (DAPI, white) to visualize all cell bodies. Progenitor cells at the midline are negative for DLX1 (DAPI+). (H,I) Magnifications of the regions in the boxes in D and E. HCR-FISH labeling EOMESA, SLC17A7 and GAD1B in combination with DAPI. The progenitor cells at the ventricular surface are negative for EOMESA (DAPI+). (H) A stream of low-level EOMESA+ cells is visible (area between the dotted lines), stretching from medial to ventrolateral pallium. This band is devoid of SLC17A7+ expression (asterisk). (I) A clear border is discernable between inhibitory (GAD1B+) and excitatory (SLC17A7+ and/or EOMESA+) cells around the midline, indicated with a dotted line. GAD1B+ cells are found scattered throughout the pallium (white arrowheads). (A-F) Scale bars: 50 µm (A-F); 20 µm (G-I). Ha, habenula; Po, preoptic area.

Acknowledgments
This image is the copyrighted work of the attributed author or publisher, and ZFIN has permission only to display this image to its users. Additional permissions should be obtained from the applicable author or publisher of the image. Full text @ Biol. Open