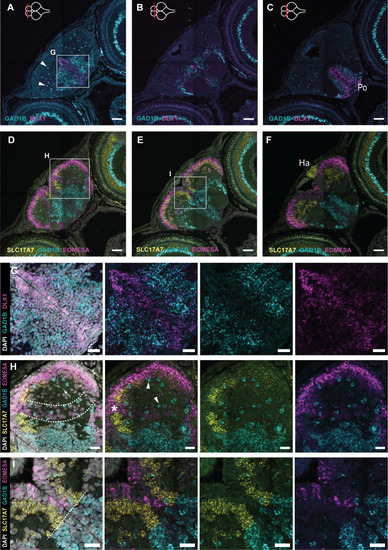
Excitatory and inhibitory neurons in the 5 dph telencephalon. (A-C) Coronal sections of the telencephalon at 5 dph along the anterior-posterior axis. HCR-FISH targeting DLX1 (magenta) and GAD1B (turquoise) mRNA expression shows the distribution of immature and mature inhibitory neurons, respectively. (D-F) Adjacent coronal sections of A-C; HCR-FISH targeting EOMESA (magenta), SLC17A7 (yellow) and GAD1B (turquoise) mRNA expression shows the distribution of immature and mature excitatory neurons, and the mature inhibitory neurons, respectively. The anterior-posterior position of the sections is indicated with a red line on the top-view brain illustration in the upper-left corner of A-C. The border of the telencephalon (posterior-most section, C,F) is recognizable based on the presence of the habenula on top of the dorsal pallial surface, positive for SLC17A7. (G) Magnification of the region in the box in A. HCR-FISH labeling DLX1 and GAD1B in combination with a nuclear stain (DAPI, white) to visualize all cell bodies. Progenitor cells at the midline are negative for DLX1 (DAPI+). (H,I) Magnifications of the regions in the boxes in D and E. HCR-FISH labeling EOMESA, SLC17A7 and GAD1B in combination with DAPI. The progenitor cells at the ventricular surface are negative for EOMESA (DAPI+). (H) A stream of low-level EOMESA+ cells is visible (area between the dotted lines), stretching from medial to ventrolateral pallium. This band is devoid of SLC17A7+ expression (asterisk). (I) A clear border is discernable between inhibitory (GAD1B+) and excitatory (SLC17A7+ and/or EOMESA+) cells around the midline, indicated with a dotted line. GAD1B+ cells are found scattered throughout the pallium (white arrowheads). (A-F) Scale bars: 50 µm (A-F); 20 µm (G-I). Ha, habenula; Po, preoptic area.
|
